Spring Boot Observability
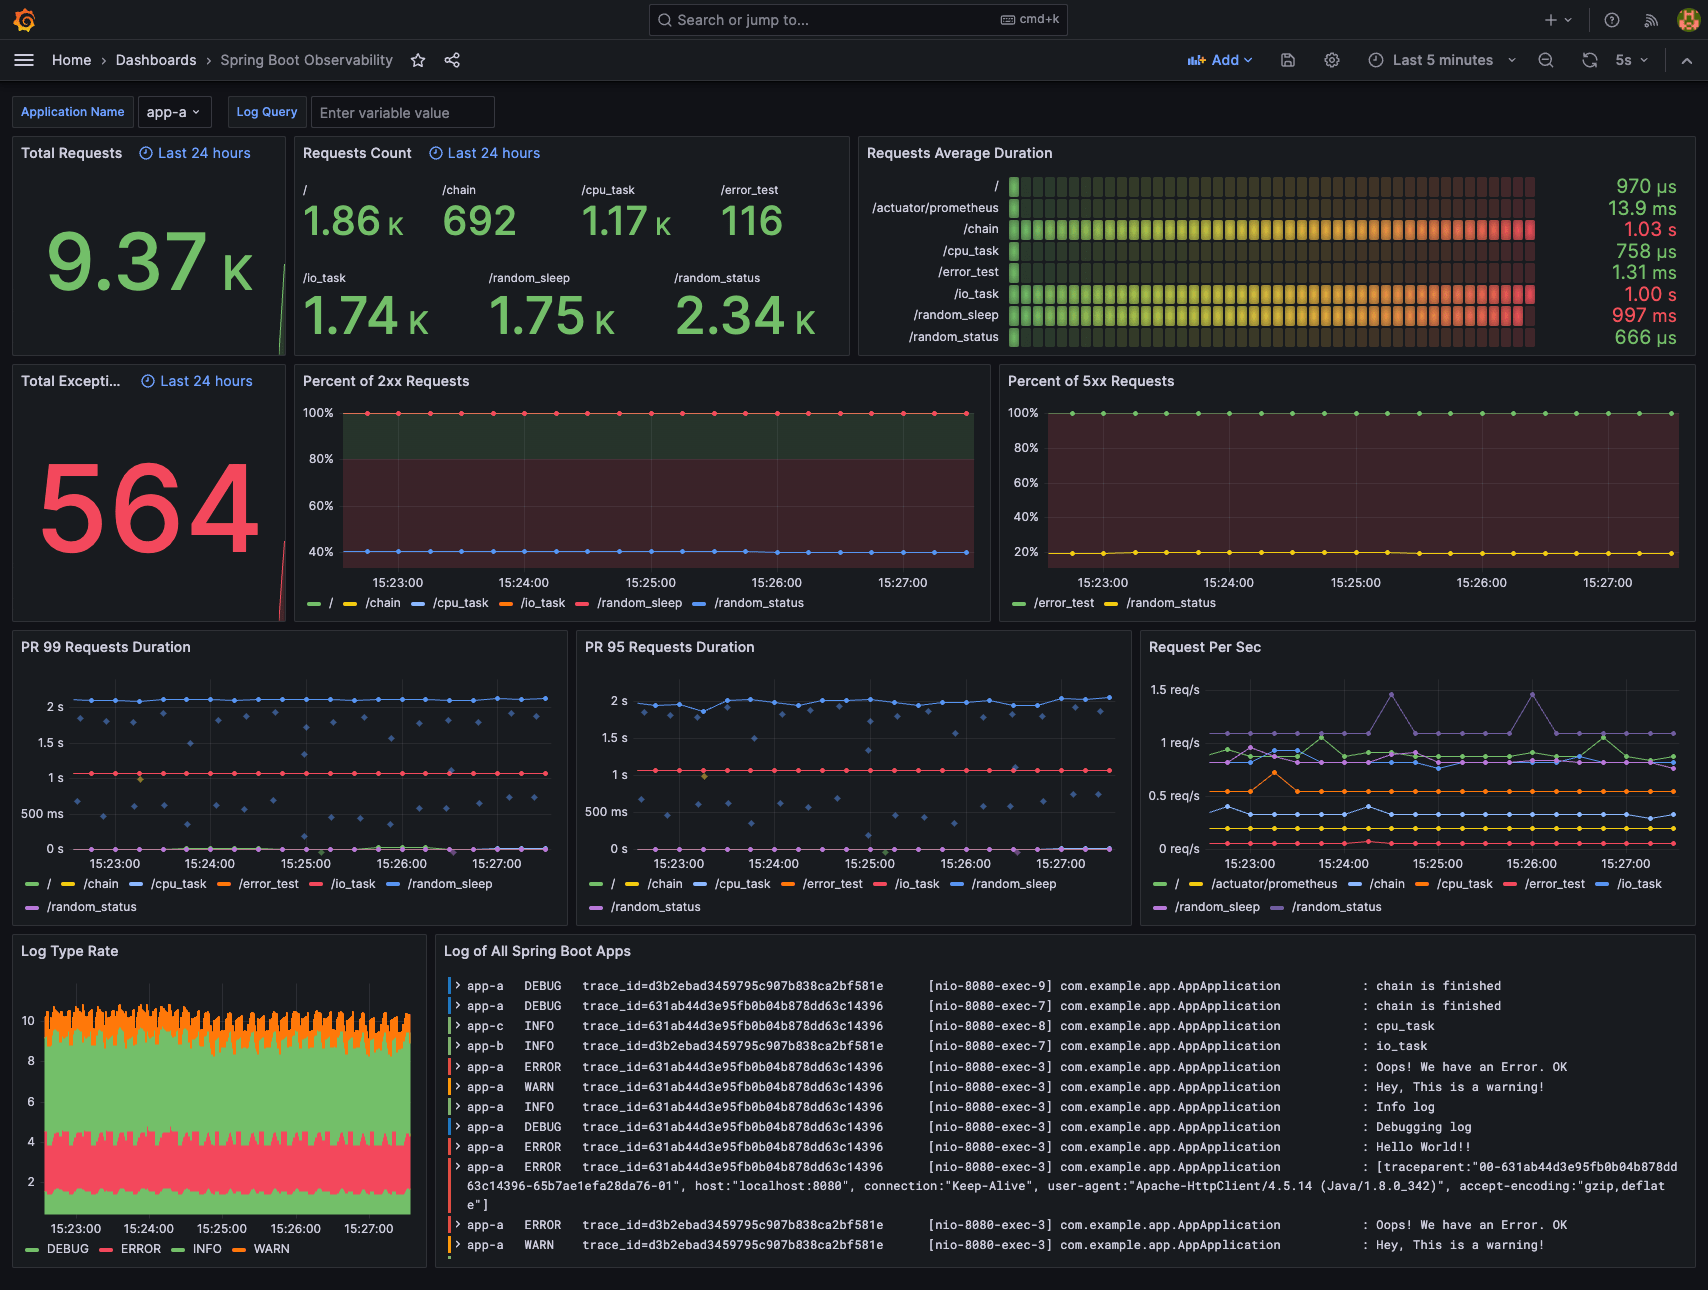
Observe the Spring Boot application with three pillars of observability on Grafana:
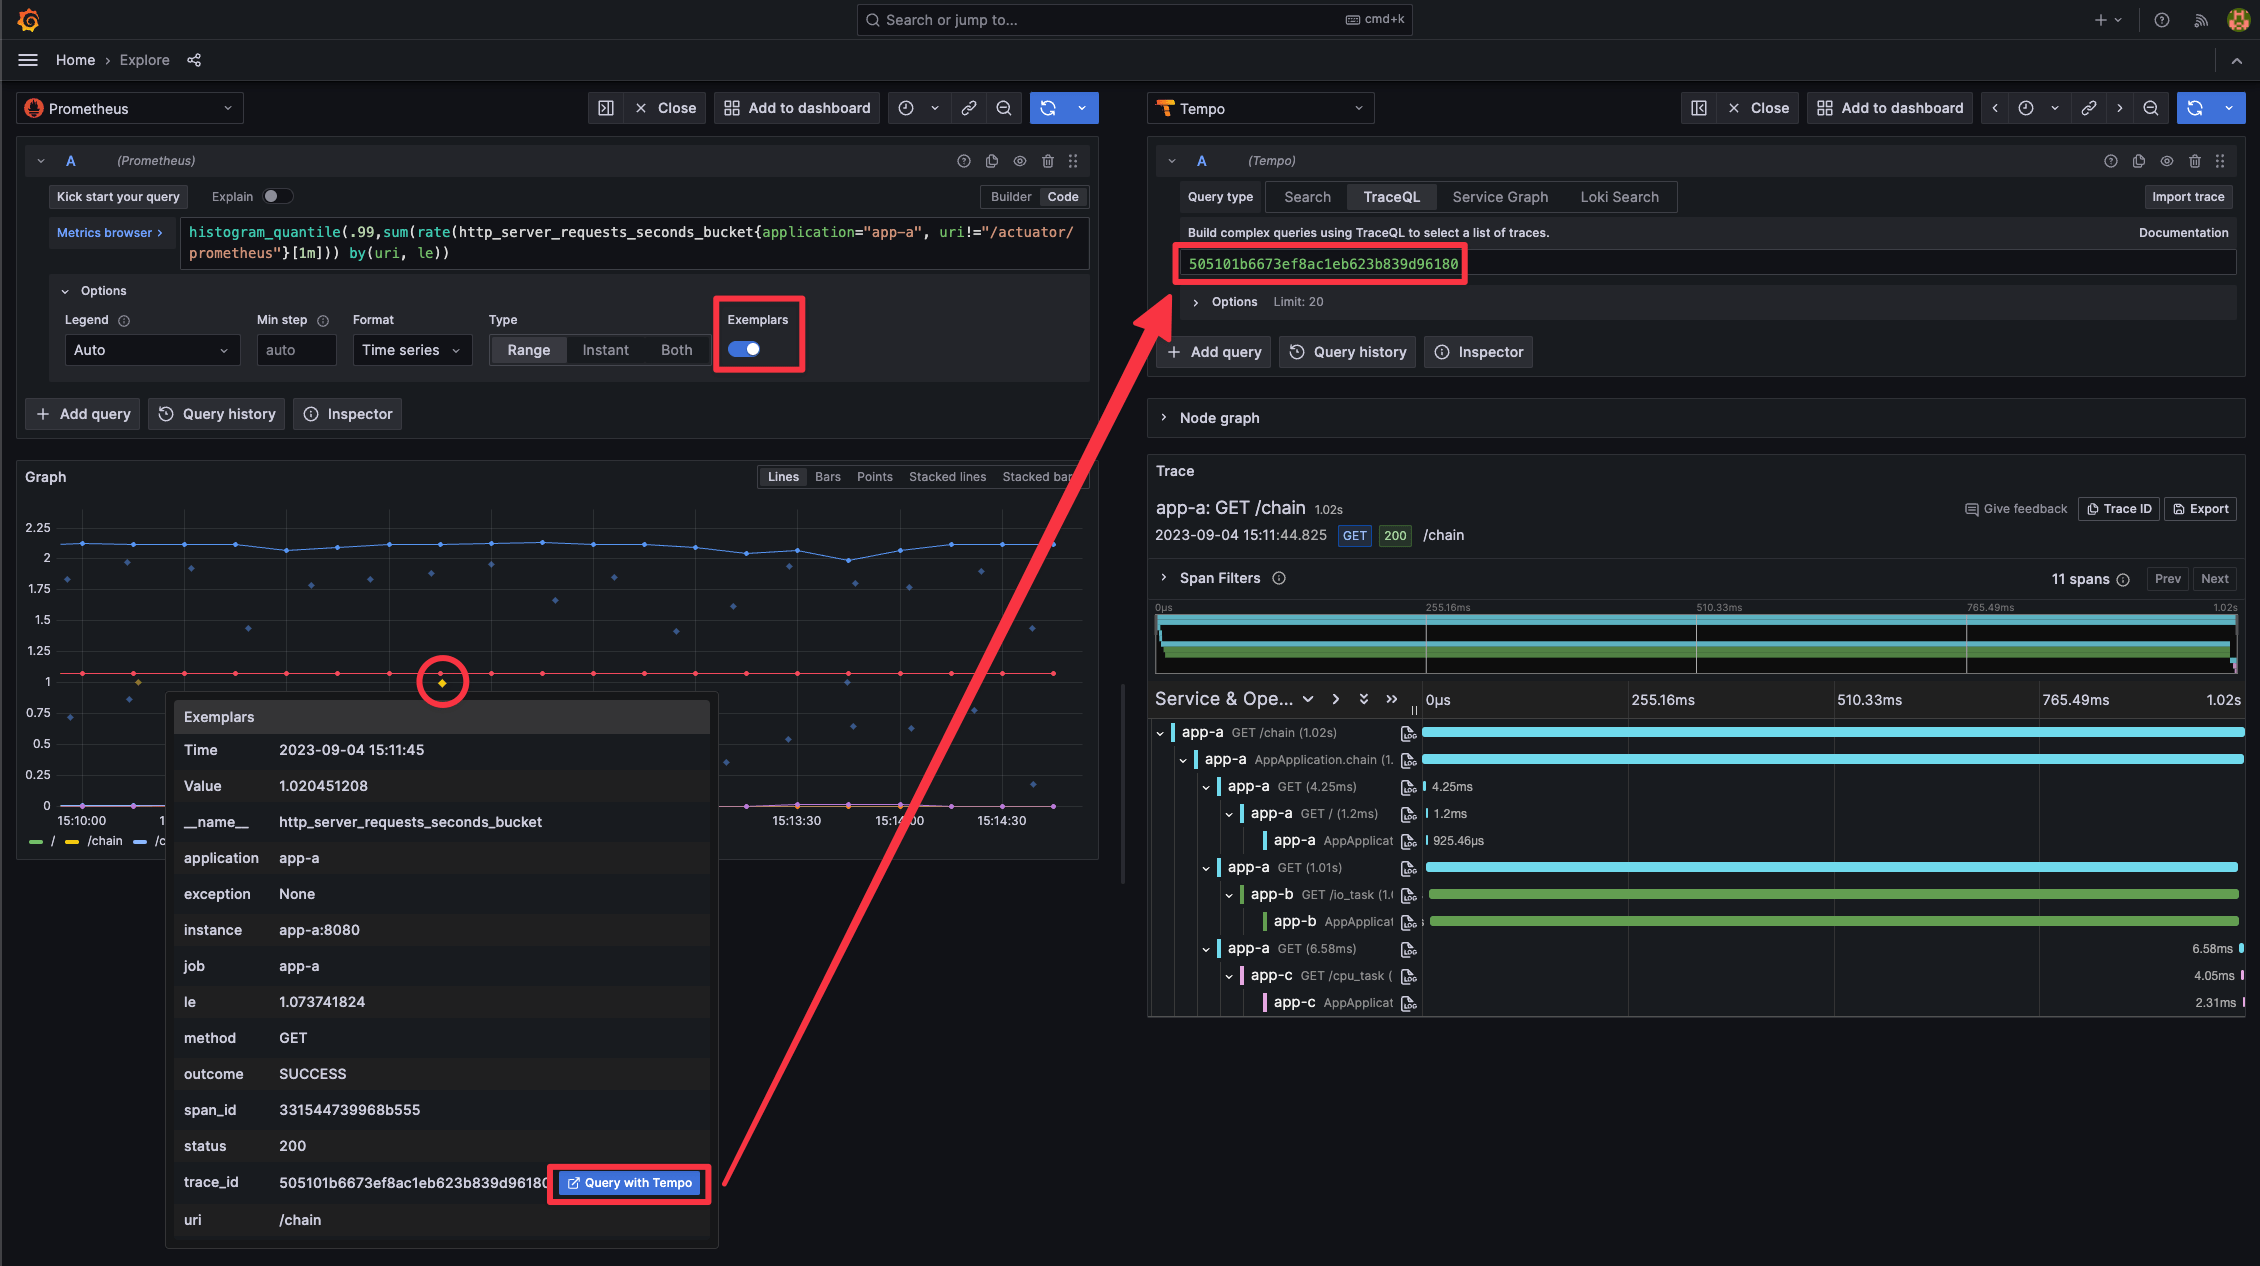
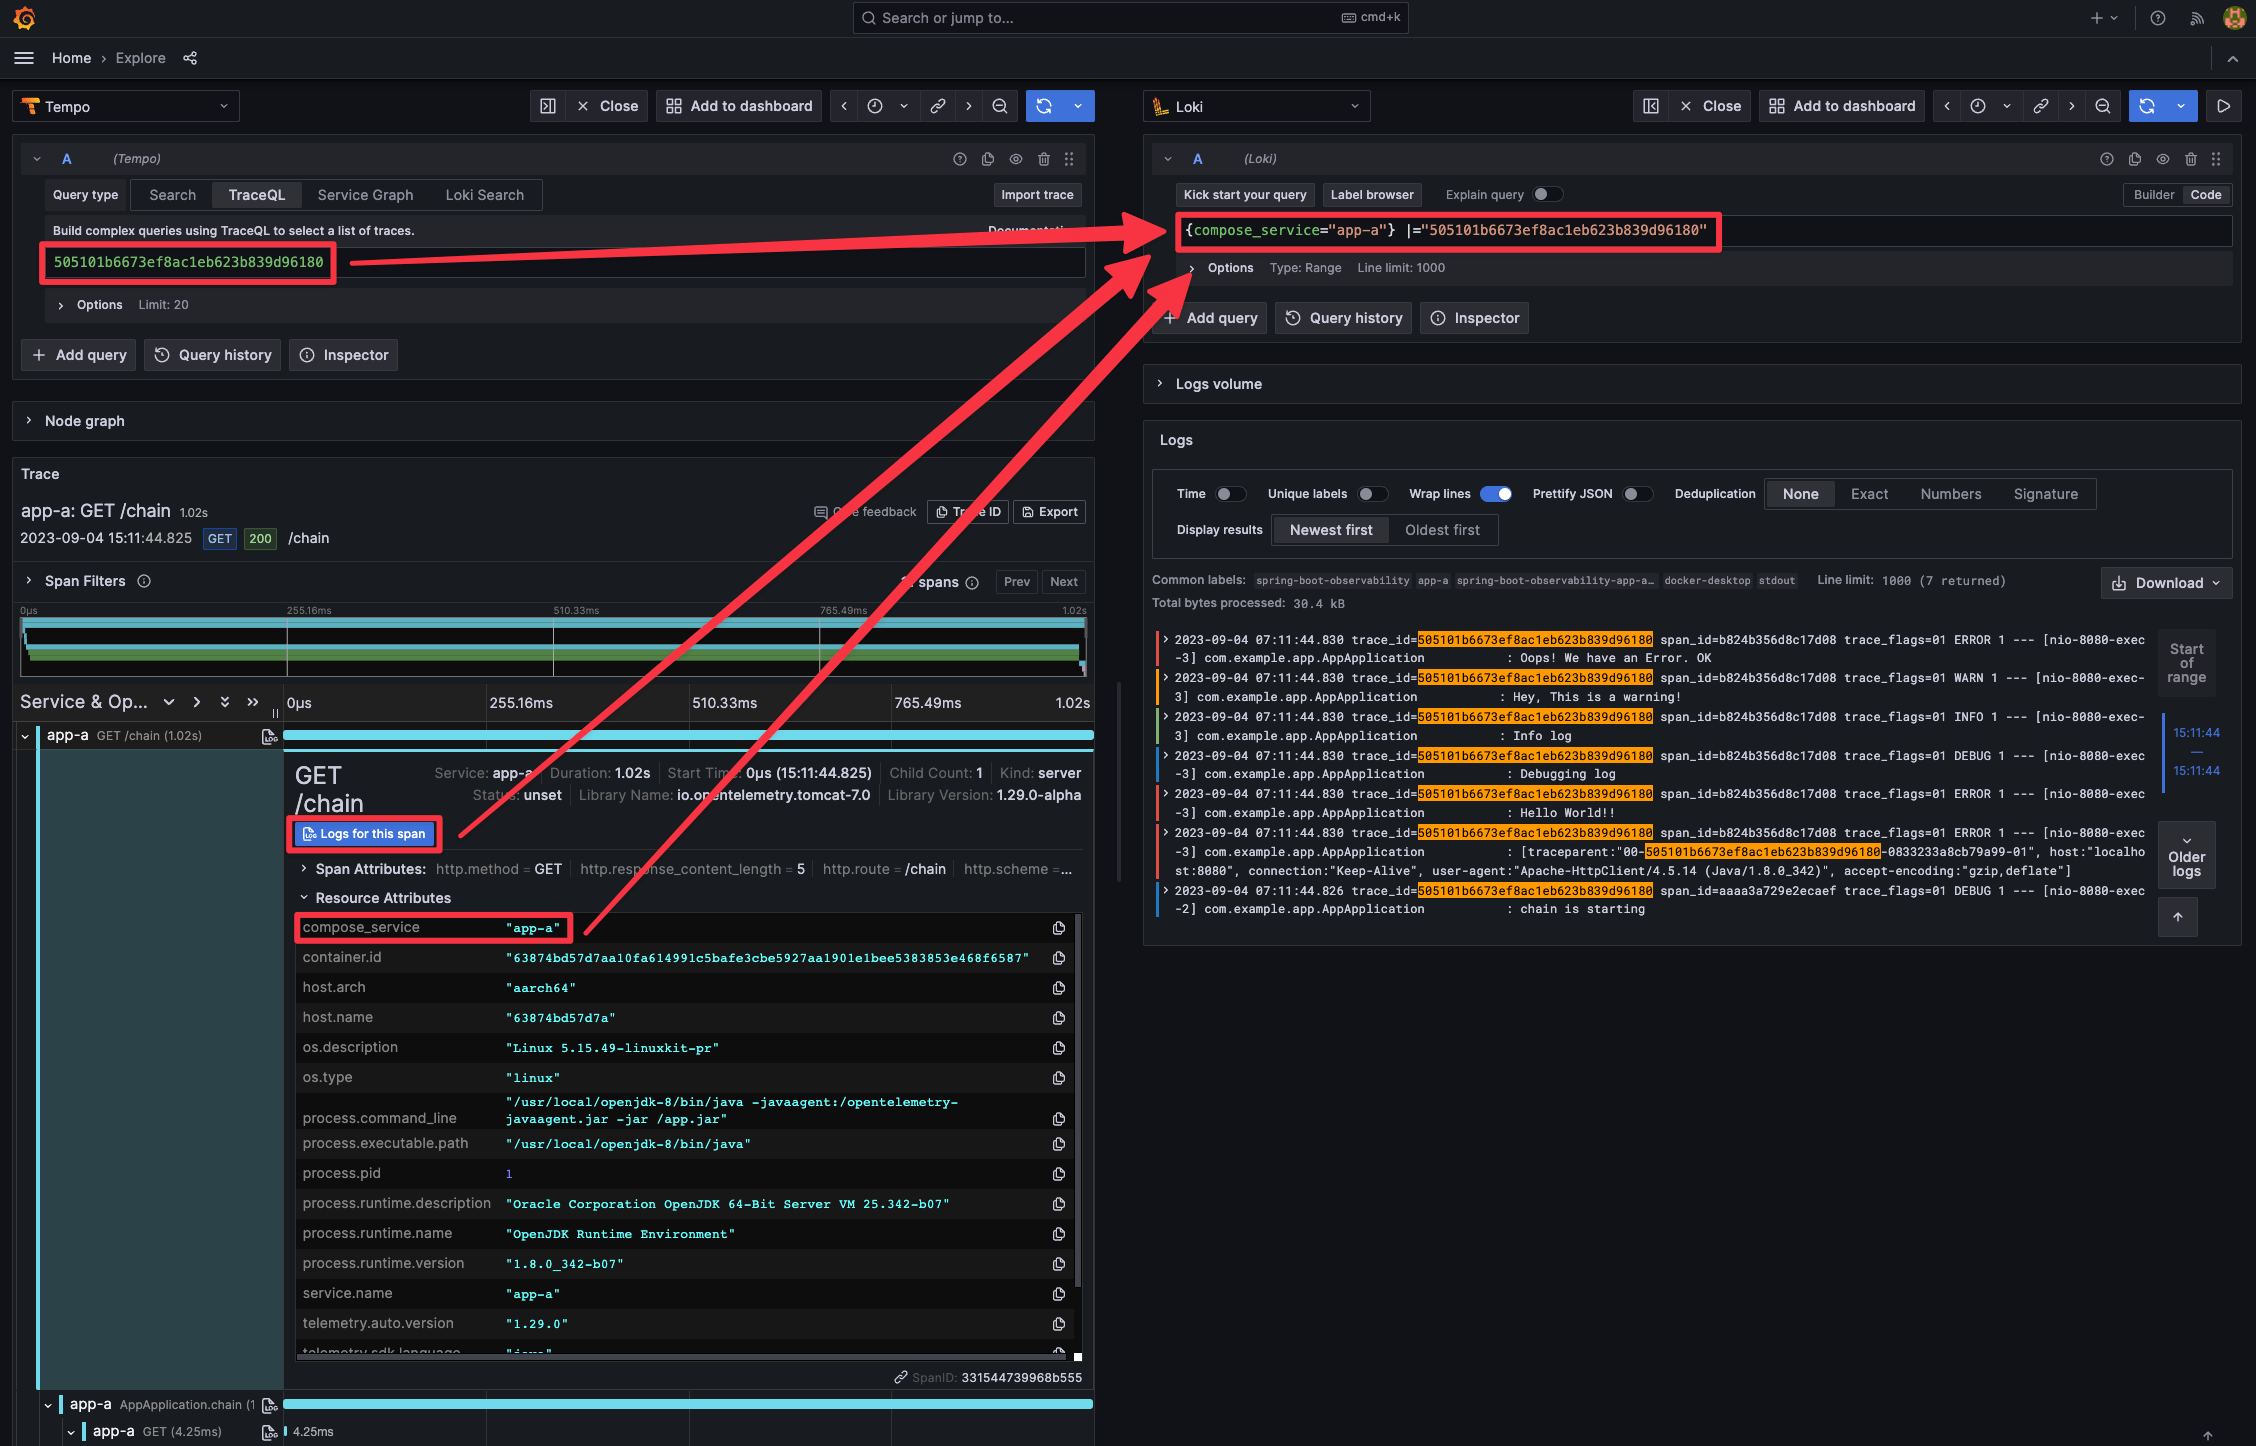
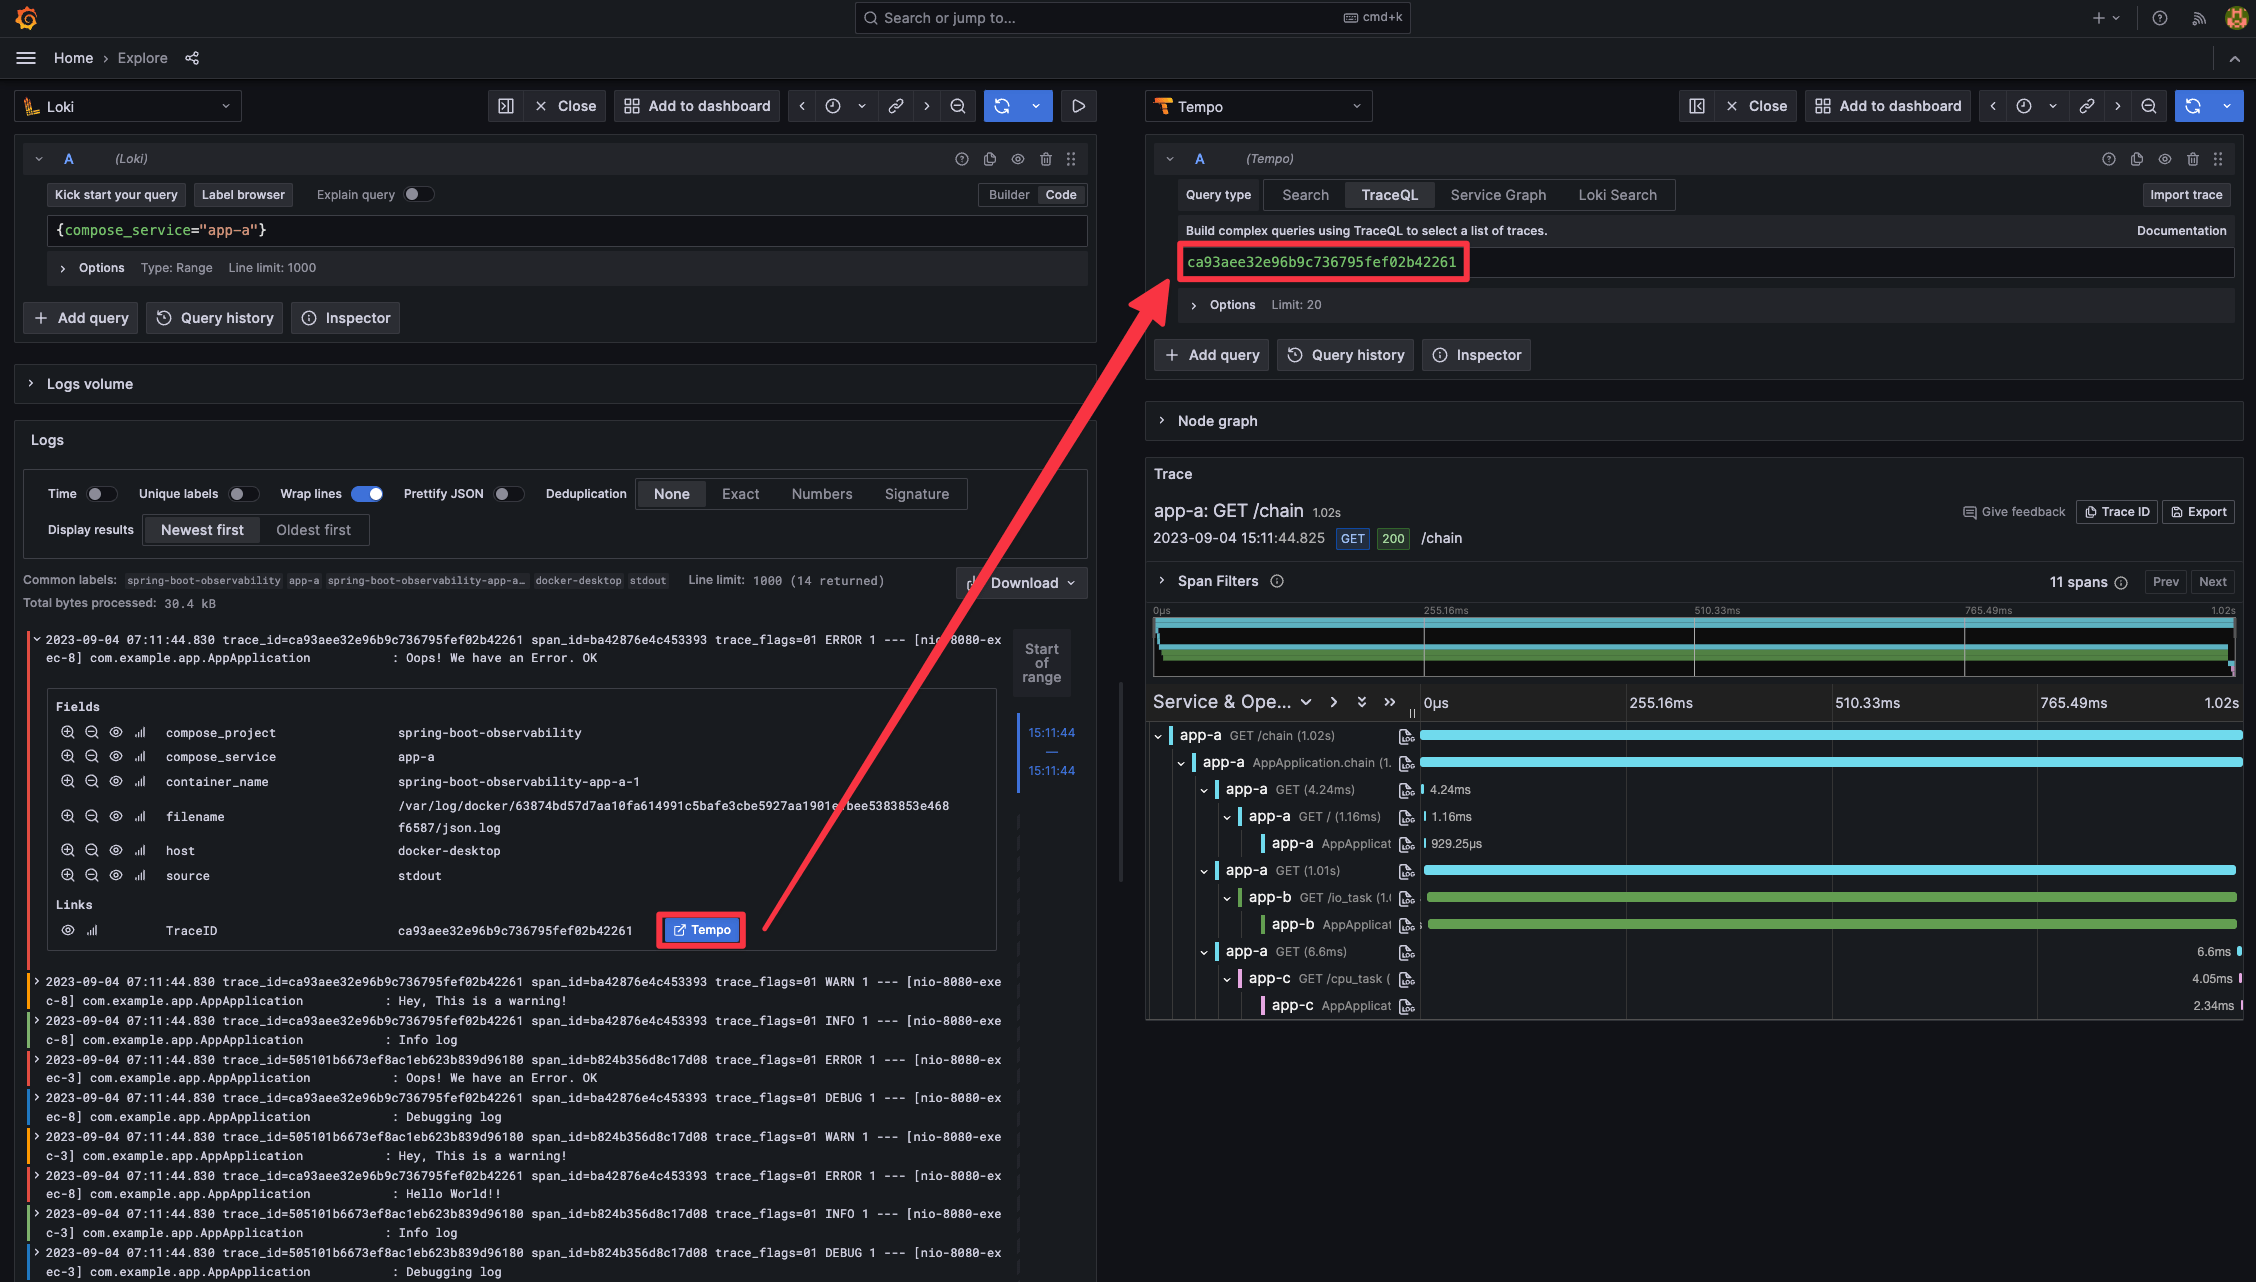
- Traces with Tempo and OpenTelemetry Instrumentation for Java
- Metrics with Prometheus, Spring Boot Actuator, and Micrometer
- Logs with Loki and Logback
Check more details on the GitHub repository: Spring Boot with Observability.
There is also a FastAPI version: FastAPI with Observability.
Data source config
Collector type:
Collector plugins:
Collector config:
Revisions
Upload an updated version of an exported dashboard.json file from Grafana
| Revision | Description | Created | |
|---|---|---|---|
| Download |
Spring Boot
Easily monitor Spring Boot with Grafana Cloud's out-of-the-box monitoring solution.
Learn more