
K8s Logs
This dashboard shows logs along with log generation rate, error and exception log rate and the amount of log generated with its rate in MB
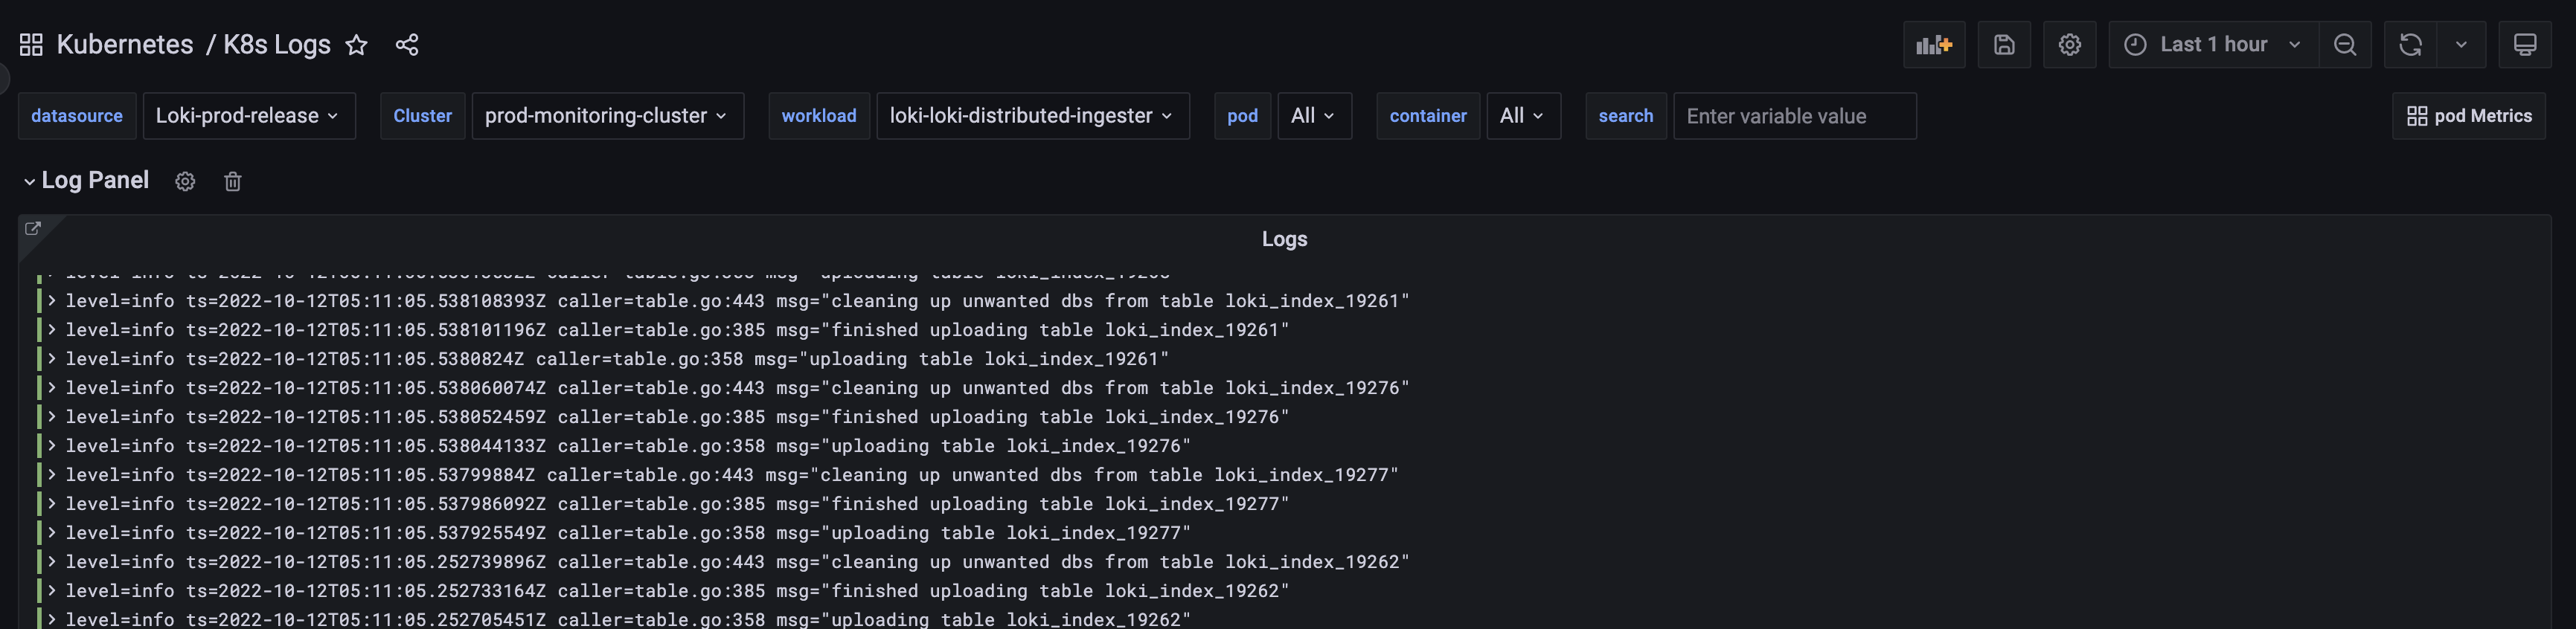
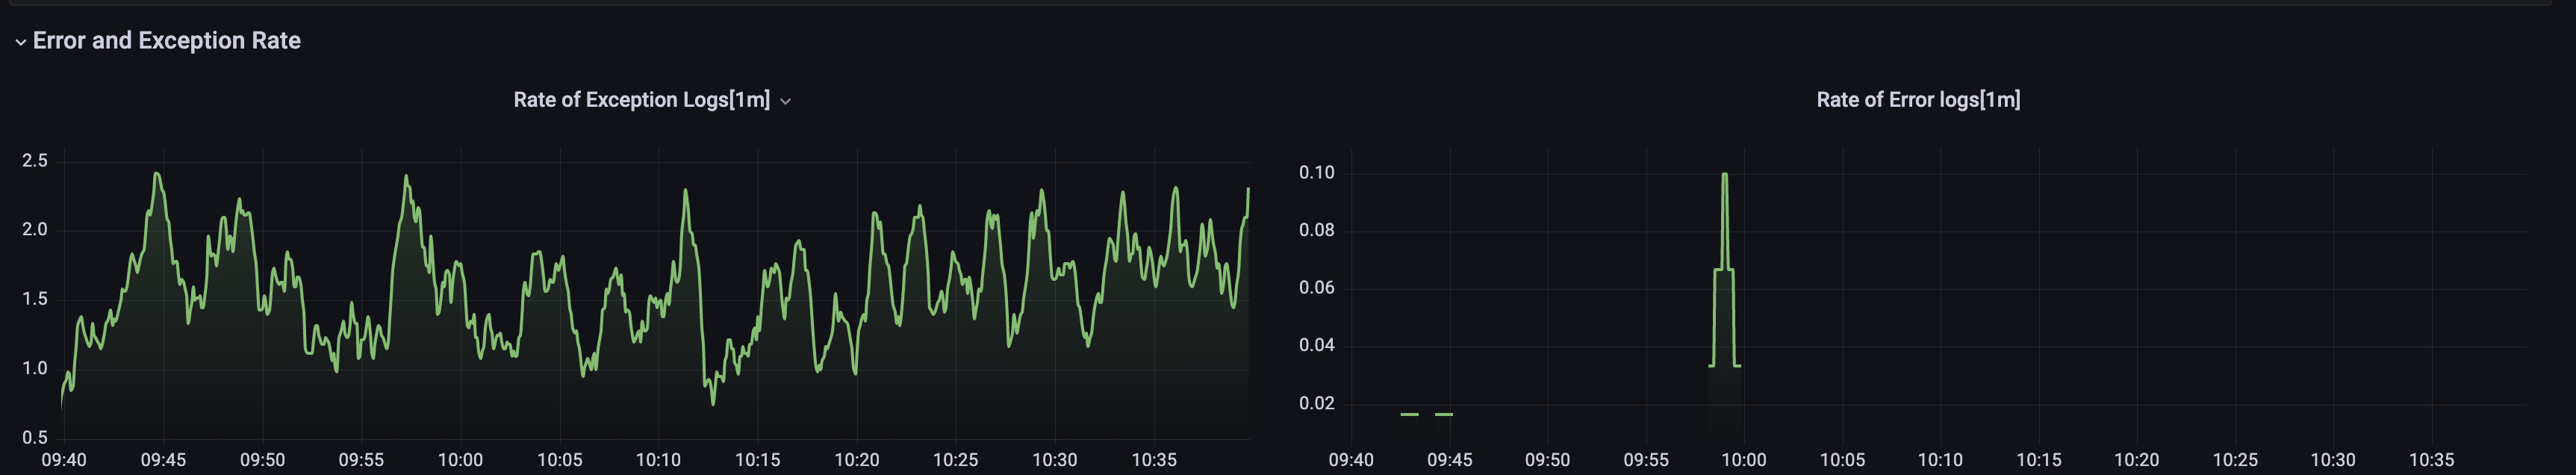
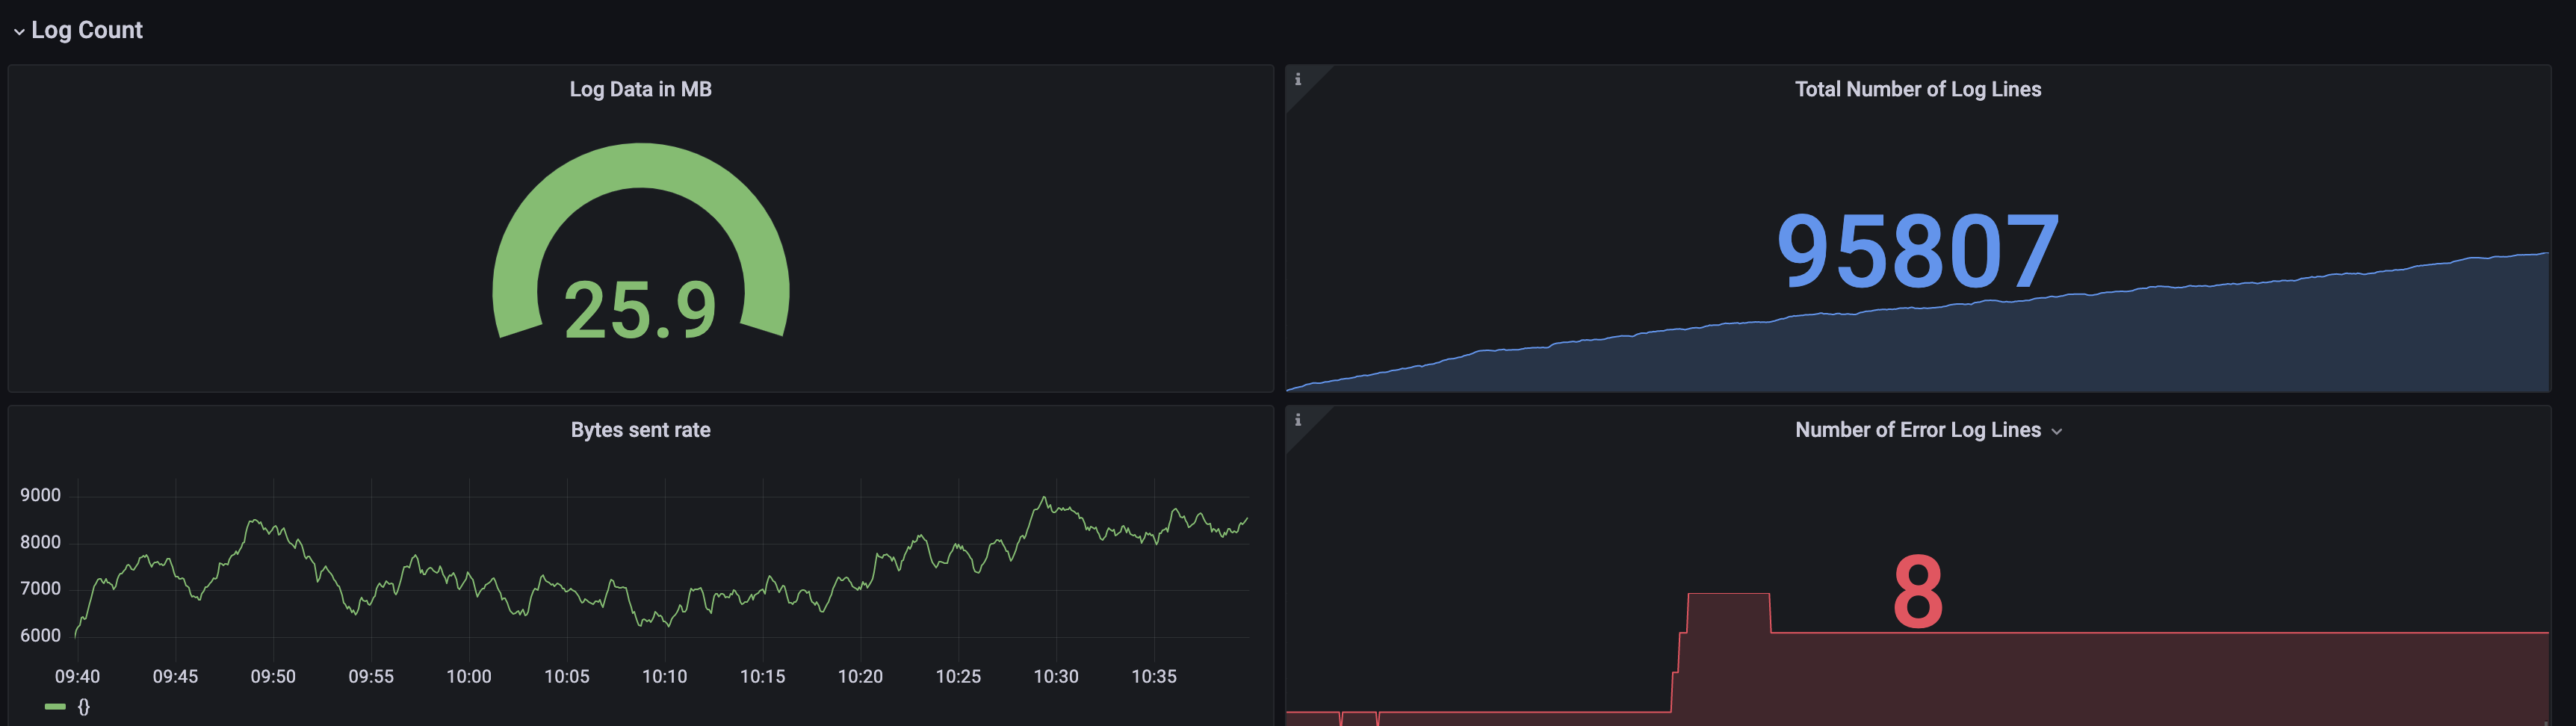
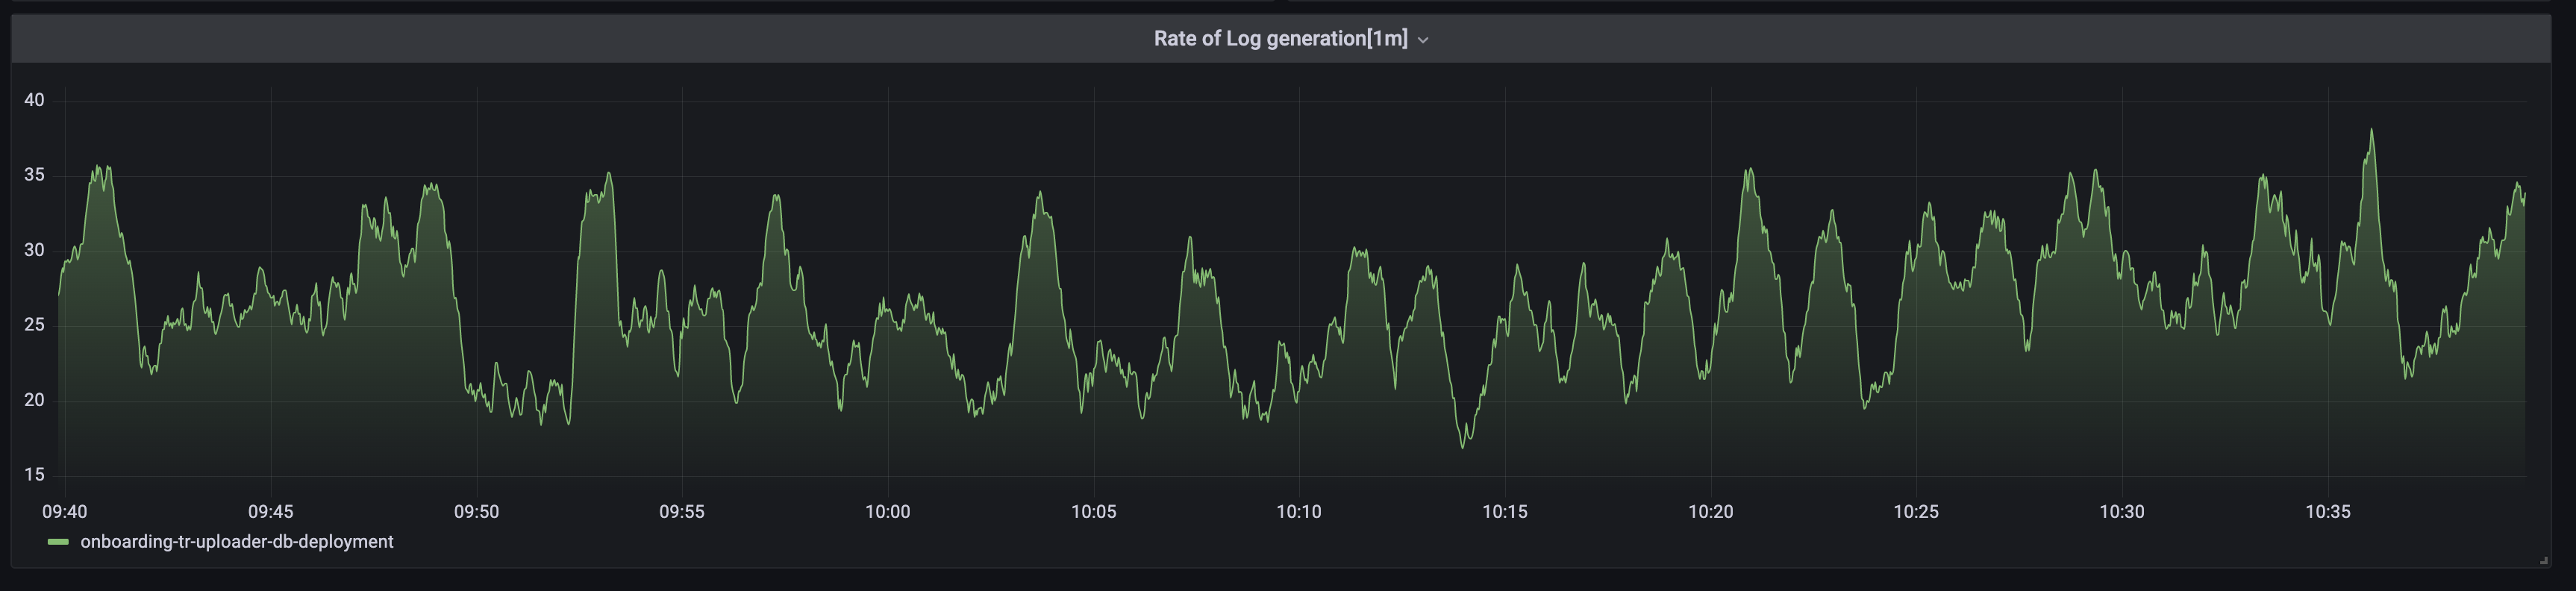
The K8s Logs dashboard uses the loki data source to create a Grafana dashboard with the gauge, logs, stat and timeseries panels.
Data source config
Collector type:
Collector plugins:
Collector config:
Revisions
Upload an updated version of an exported dashboard.json file from Grafana
| Revision | Description | Created | |
|---|---|---|---|
| Download |
Kubernetes
Monitor your Kubernetes deployment with prebuilt visualizations that allow you to drill down from a high-level cluster overview to pod-specific details in minutes.
Learn more