Kubernetes EKS Cluster (Prometheus)
Summary metrics about containers running on Kubernetes nodes. Dashboard was taken from here. This version does not reqiure you to setup the Kubernetes-app plugin. (https://github.com/grafana/kubernetes-app) Use this Helm chart to launch Grafana into a Kubernetes cluster. It will include this dashboard and many more dashboards to give you visibility into the Kubernetes Cluster. (https://github.com/sekka1/cloud-public/tree/master/kubernetes/pods/grafana-helm)
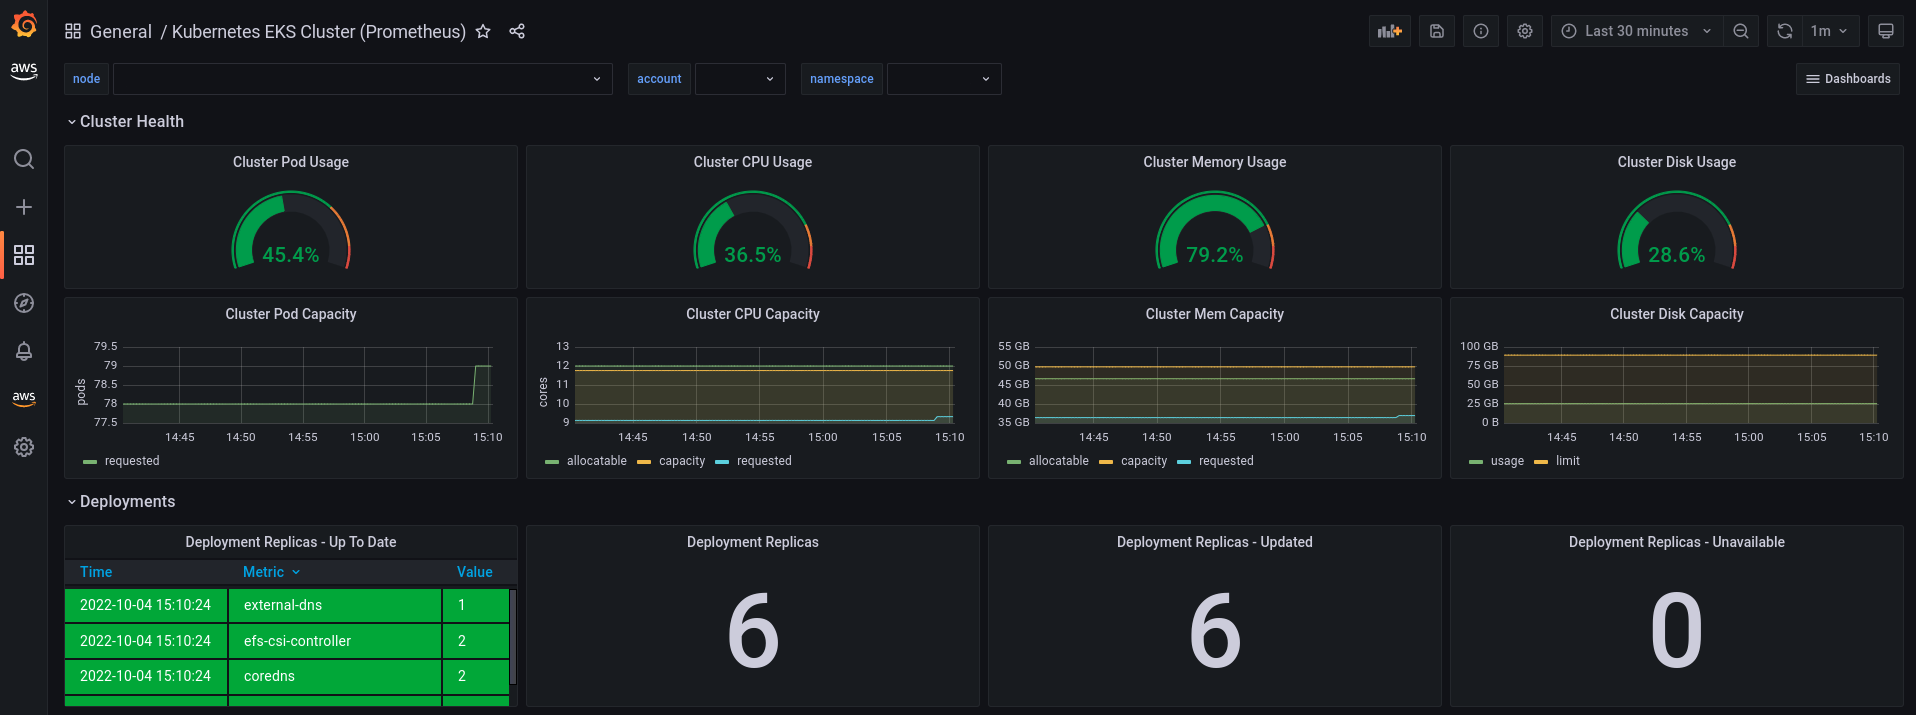
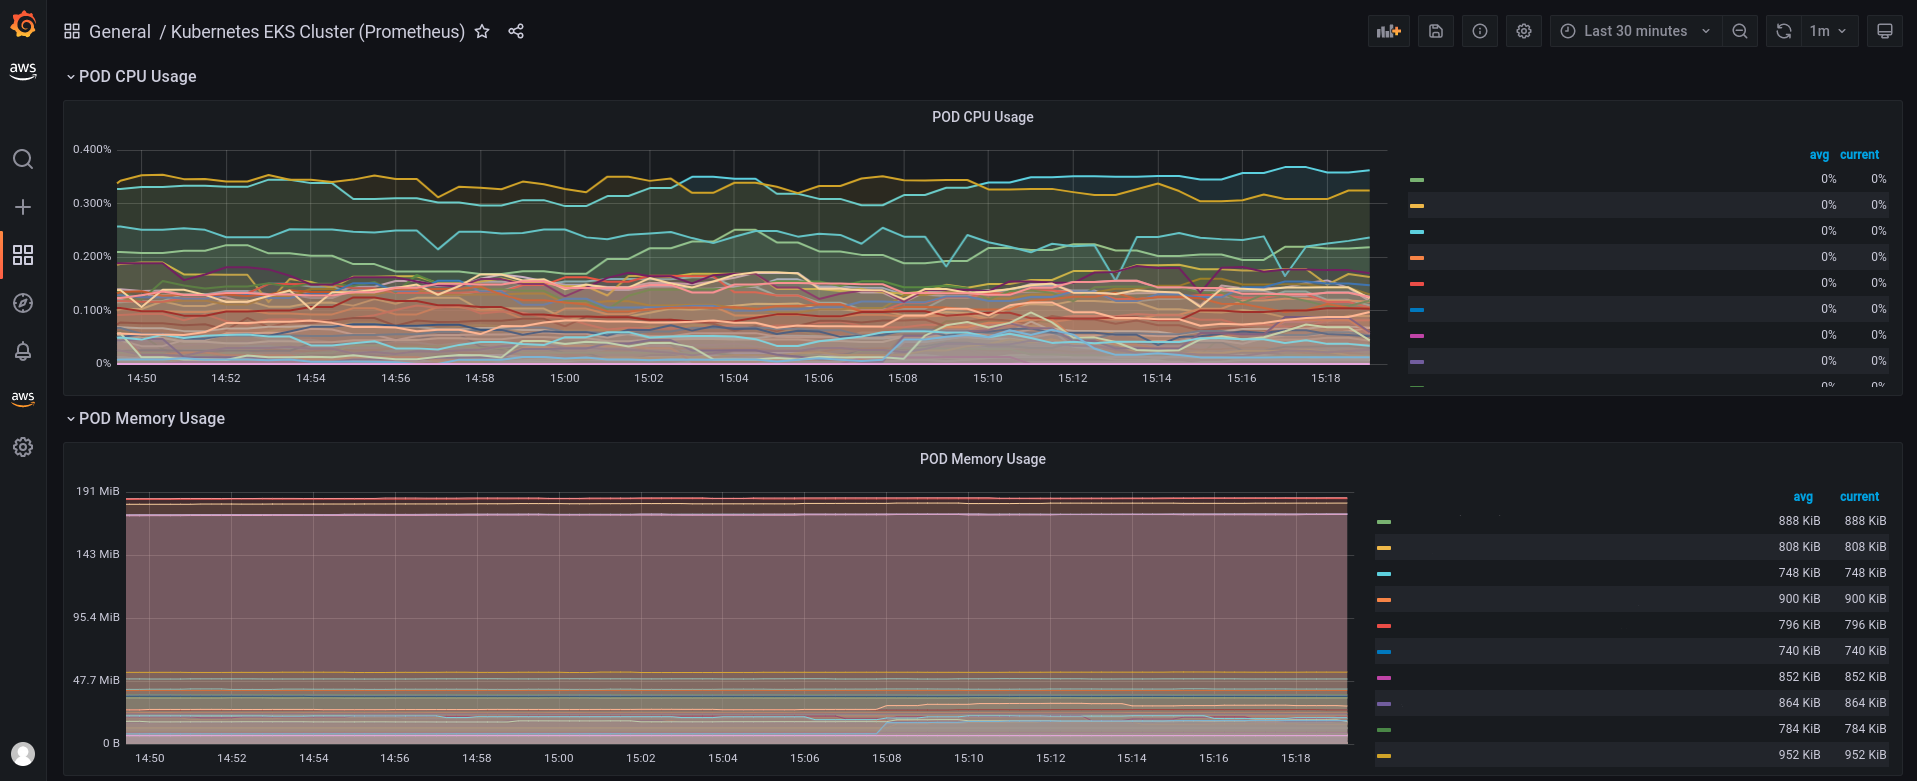
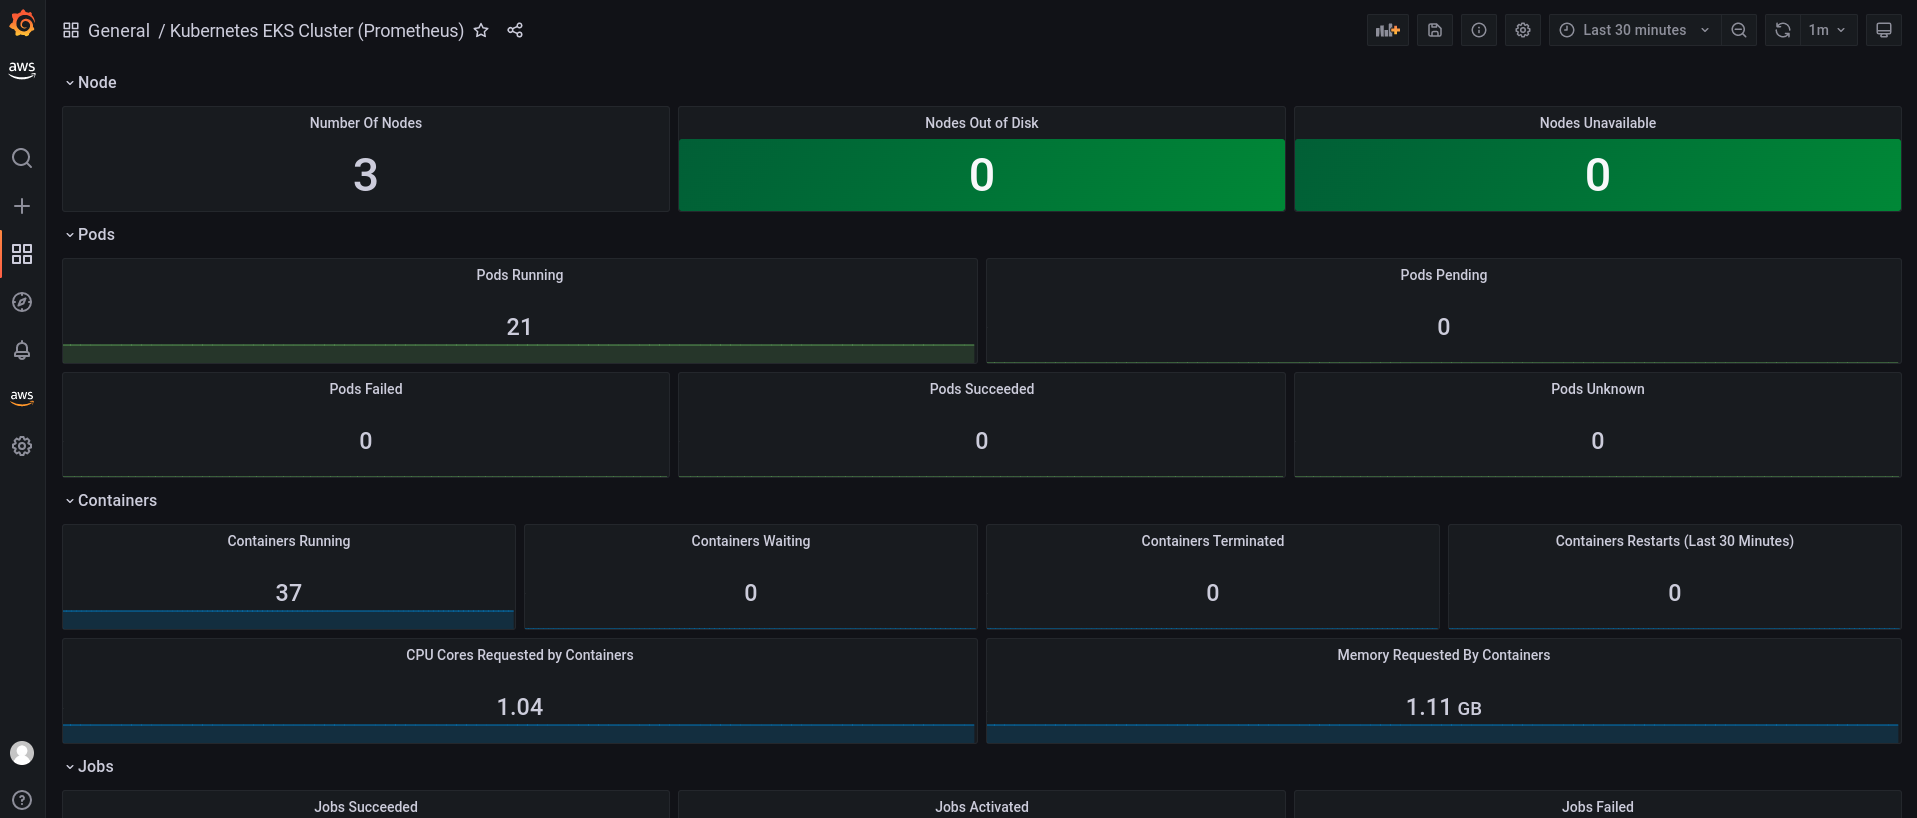
The Kubernetes EKS Cluster (Prometheus) dashboard uses the prometheus data source to create a Grafana dashboard with the gauge, graph, stat and table-old panels.
Data source config
Collector type:
Collector plugins:
Collector config:
Revisions
Upload an updated version of an exported dashboard.json file from Grafana
| Revision | Description | Created | |
|---|---|---|---|
| Download |
Kubernetes
Monitor your Kubernetes deployment with prebuilt visualizations that allow you to drill down from a high-level cluster overview to pod-specific details in minutes.
Learn more