KrakenD - Influx v2
Official Grafana dashboard for krakend metrics. Feeds from InfluxDB v2 using Flux queries. https://www.krakend.io/docs/extended-metrics/grafana/
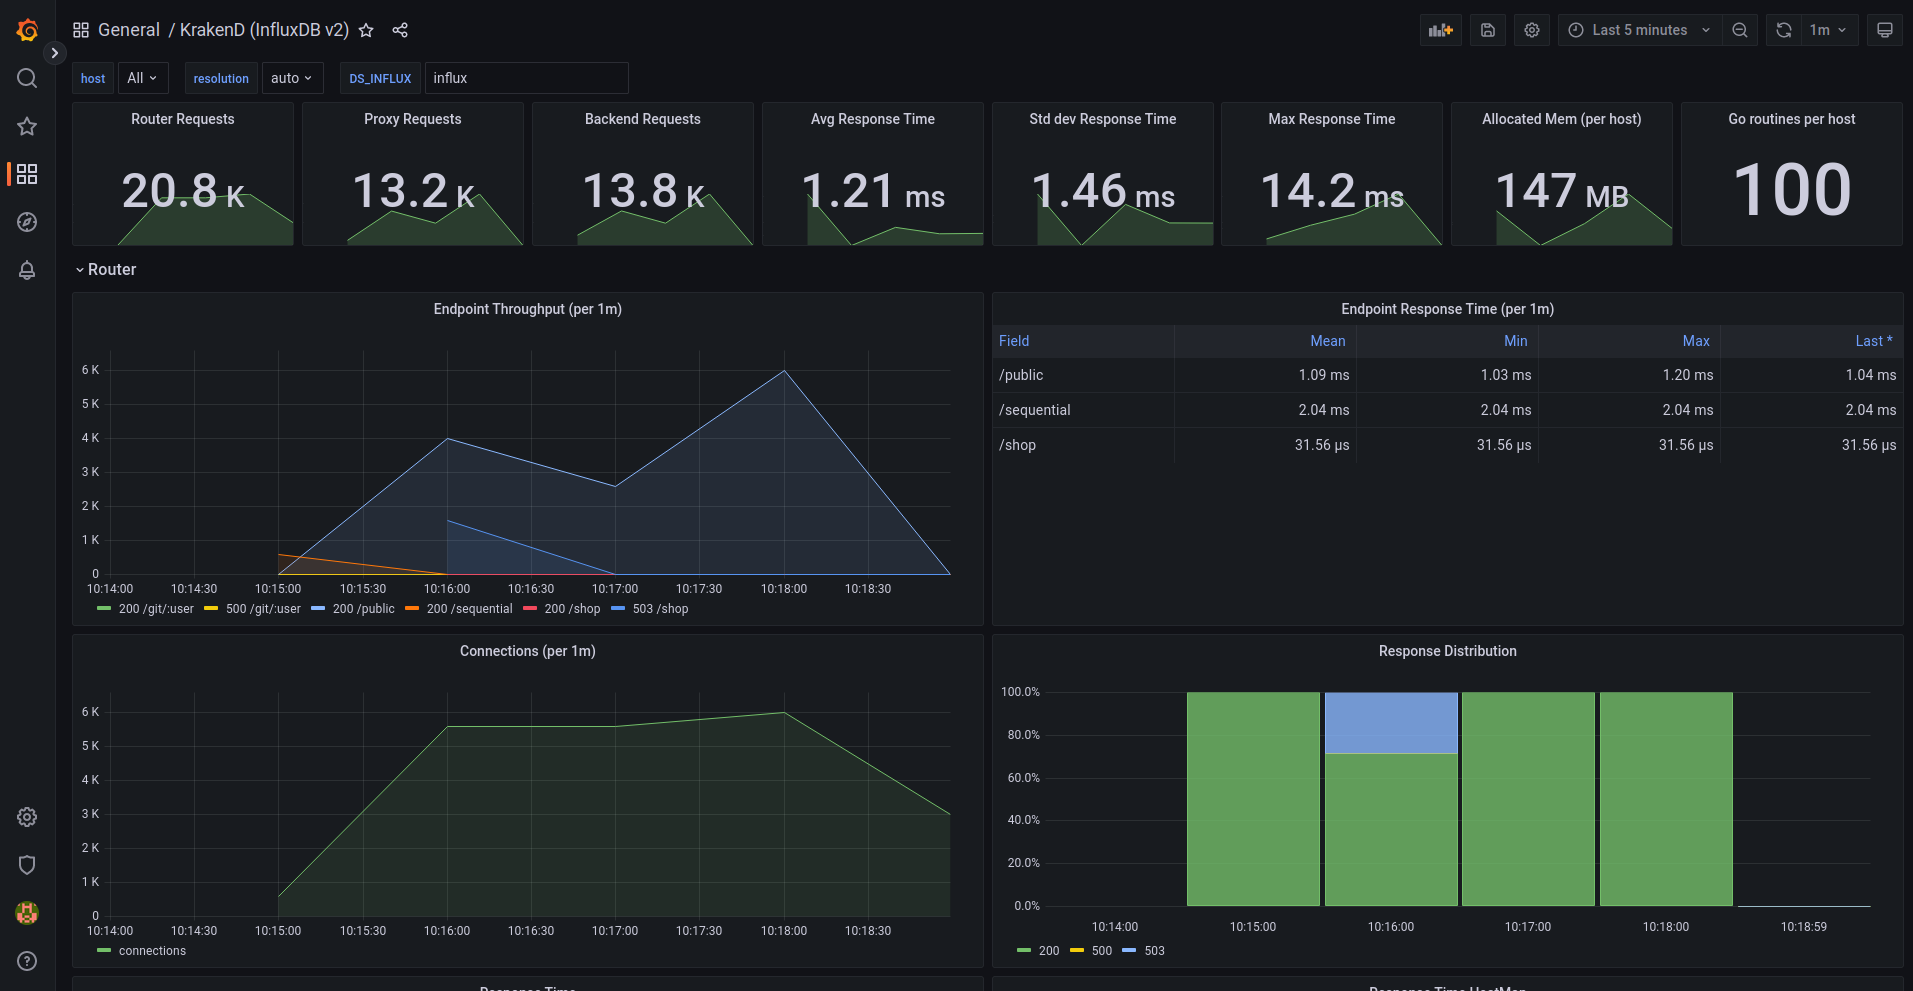
This dashboards feeds from an InfluxDB v2 database populated automatically by the KrakenD component telemetry/influx.
The dashboard is extensive and offers you metrics like:
- Requests from users to KrakenD
- Requests from KrakenD to your backends
- Response times
- Memory usage and details
- Endpoints and status codes
- Heatmaps
- Open connections
- Throughput
- Distributions, timers, garbage collection and a long etcetera
Data source config
Collector type:
Collector plugins:
Collector config:
Revisions
Upload an updated version of an exported dashboard.json file from Grafana
| Revision | Description | Created | |
|---|---|---|---|
| Download |