Docker Swarm Service and Container Metrics
Docker swarm services and container metrics via Google Cadvisor
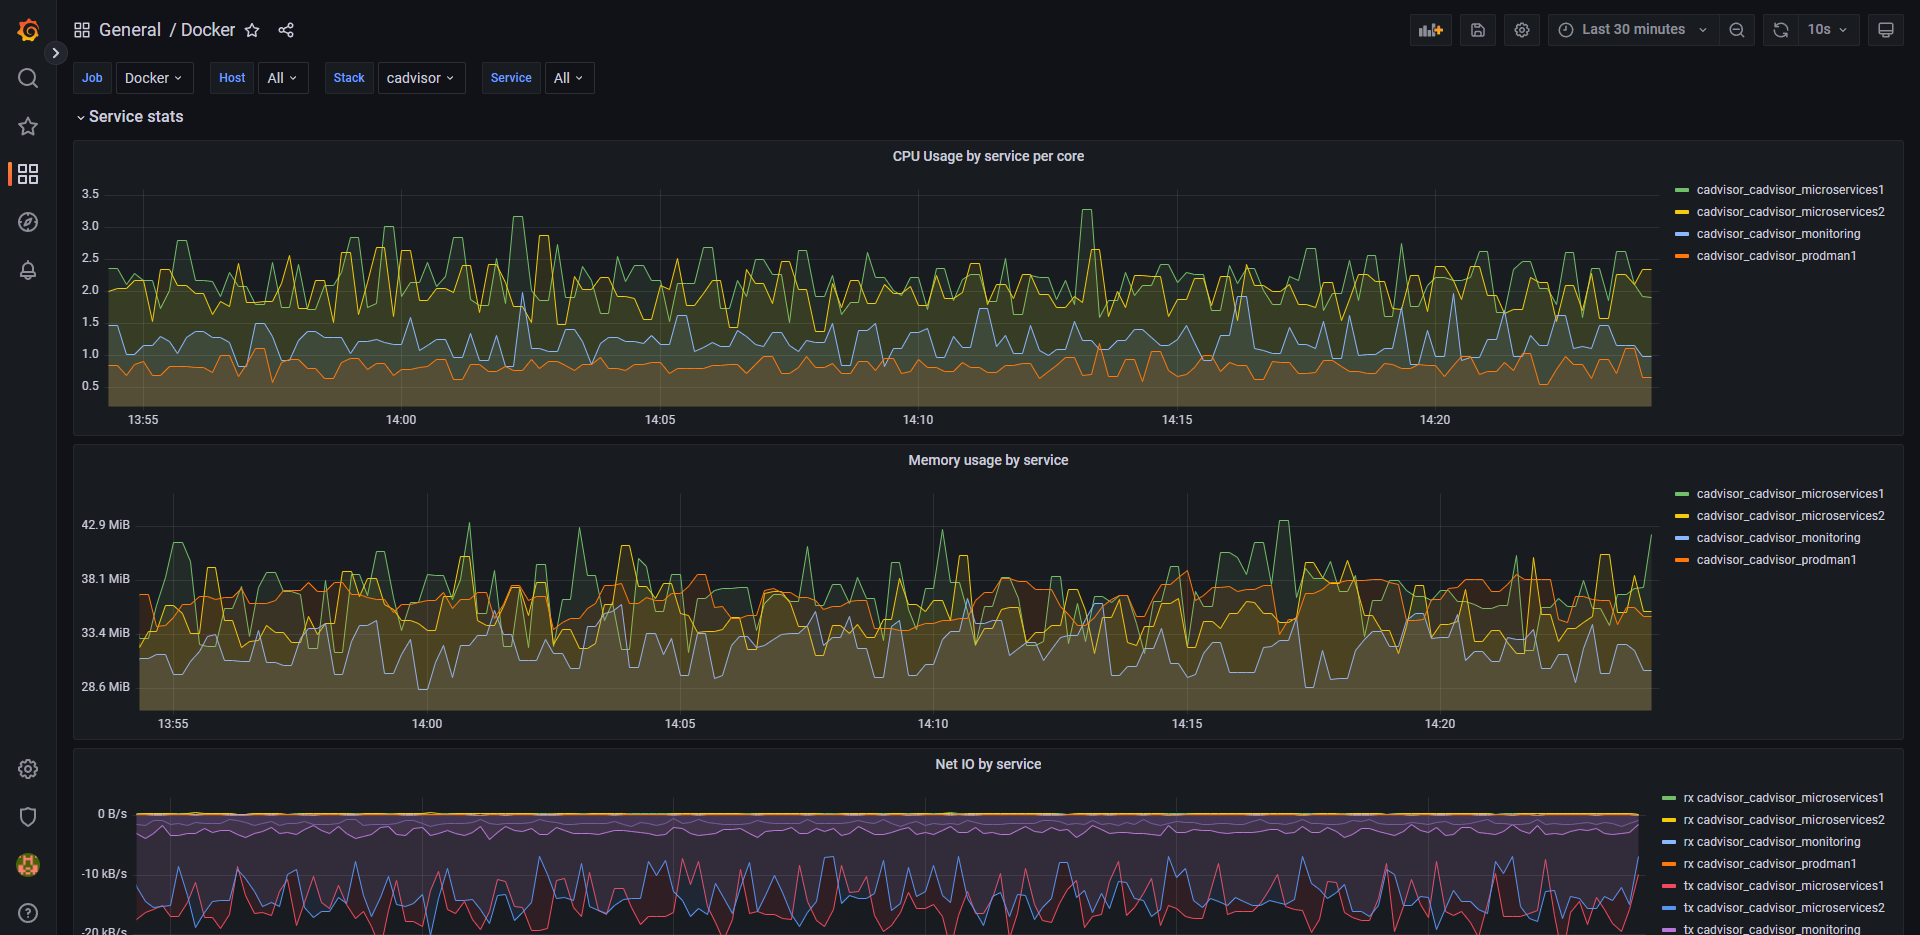
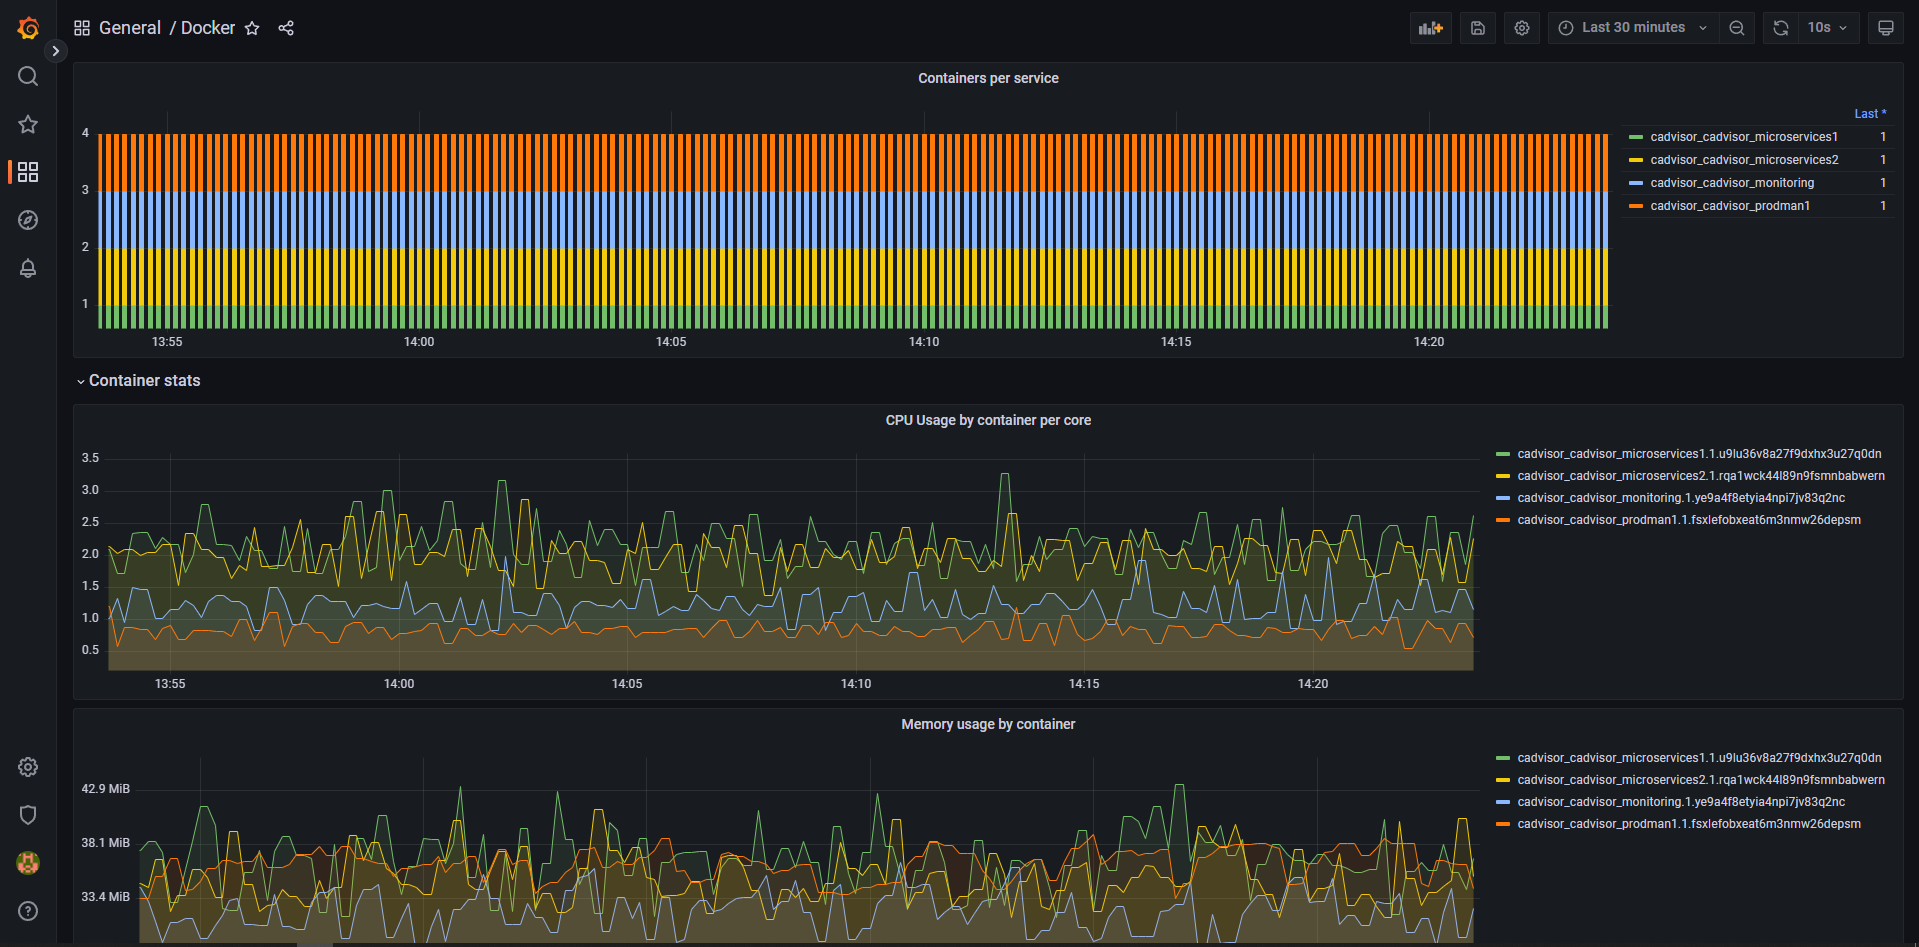
Grafana dashboard for Prometheus collected metrics from Google Cadvisor container. Contains most wanted swarm metrics for all containers like CPU usage, Memory Usage, Network Traffic and Disk IO values for swarm services and application containers.
Cadvisor deployment manifest: version: ‘3.9’
networks: cadvisor: external: true name: “host”
x-placement-conditions: &placement-conditions constraints: [ node.platform.os == linux ]
x-update-conditions: &update-conditions order: start-first delay: 60s parallelism: 1
x-restart-conditions: &restart-conditions condition: any delay: 5s
x-health-timings: &health-timings interval: 5s timeout: 1s start_period: 60s retries: 3
services: cadvisor: image: gcr.io/cadvisor/cadvisor:v0.45.0 volumes: - /:/rootfs:ro - /var/run:/var/run:rw - /sys:/sys:ro - /var/lib/docker/:/var/lib/docker:ro networks: - cadvisor healthcheck: test: nc -vz 127.0.0.1 8080 || exit 1 «: *health-timings command: - “–housekeeping_interval=10s” - “–docker_only=true” deploy: «: *update-conditions restart_policy: «: *restart-conditions condition: any delay: 5s mode: replicated replicas: 1 placement: «: placement-conditions resources: limits: cpus: ‘1’ memory: ‘1G’
Grafana and prometheus deployment manifest: version: “3.9”
networks: metrics: external: true name: “host”
x-placement-conditions: &placement-conditions constraints: [ node.platform.os == linux ]
x-update-conditions: &update-conditions order: start-first delay: 60s parallelism: 1
x-restart-conditions: &restart-conditions condition: any delay: 5s
x-health-timings: &health-timings interval: 5s timeout: 1s start_period: 60s retries: 3
services: grafana: image: grafana/grafana:9.1.4 networks: - metrics healthcheck: test: nc -vz 127.0.0.1 3000 || exit 1 «: *health-timings volumes: - /var/lib/grafana/grafana.db:/var/lib/grafana/grafana.db - /var/lib/grafana/grafana.ini:/etc/grafana/grafana.ini deploy: «: *update-conditions restart_policy: «: *restart-conditions mode: replicated replicas: 1 placement: «: *placement-conditions resources: limits: cpus: ‘1’ memory: ‘1G’
prometheus: image: prom/prometheus:v2.38.0 command: - ‘–config.file=/etc/prometheus/prometheus.yml’ - ‘–storage.tsdb.path=/prometheus’ - ‘–web.console.libraries=/etc/prometheus/console_libraries’ - ‘–web.console.templates=/etc/prometheus/consoles’ - ‘–storage.tsdb.retention.time=31d’ #- ‘–web.enable-lifecycle’ #- ‘–web.enable-admin-api’ environment: STORAGE_RETENTION: “–storage.tsdb.retention.time=93d” networks: - metrics volumes: - /var/lib/prometheus/config.yml:/etc/prometheus/prometheus.yml - /var/lib/prometheus/data:/prometheus healthcheck: test: nc -vz 127.0.0.1 9090 || exit 1 «: *health-timings deploy: «: *update-conditions restart_policy: «: *restart-conditions mode: replicated replicas: 1 placement: «: *placement-conditions resources: limits: cpus: ‘4’ memory: ‘4G’
Prometheus scrape config: scrape_configs:
- job_name: “Docker”
scheme: http
relabel_configs:
- source_labels: [address] target_label: instance regex: ‘([^:]+)(:[0-9]+)?’ replacement: ‘${1}’ static_configs:
- targets:
- your.docker.server.with.cadvisor.host:8080
Data source config
Collector config:
Upload an updated version of an exported dashboard.json file from Grafana
| Revision | Description | Created | |
|---|---|---|---|
| Download |
Docker
Easily monitor Docker with Grafana Cloud's out-of-the-box monitoring solution.
Learn more

