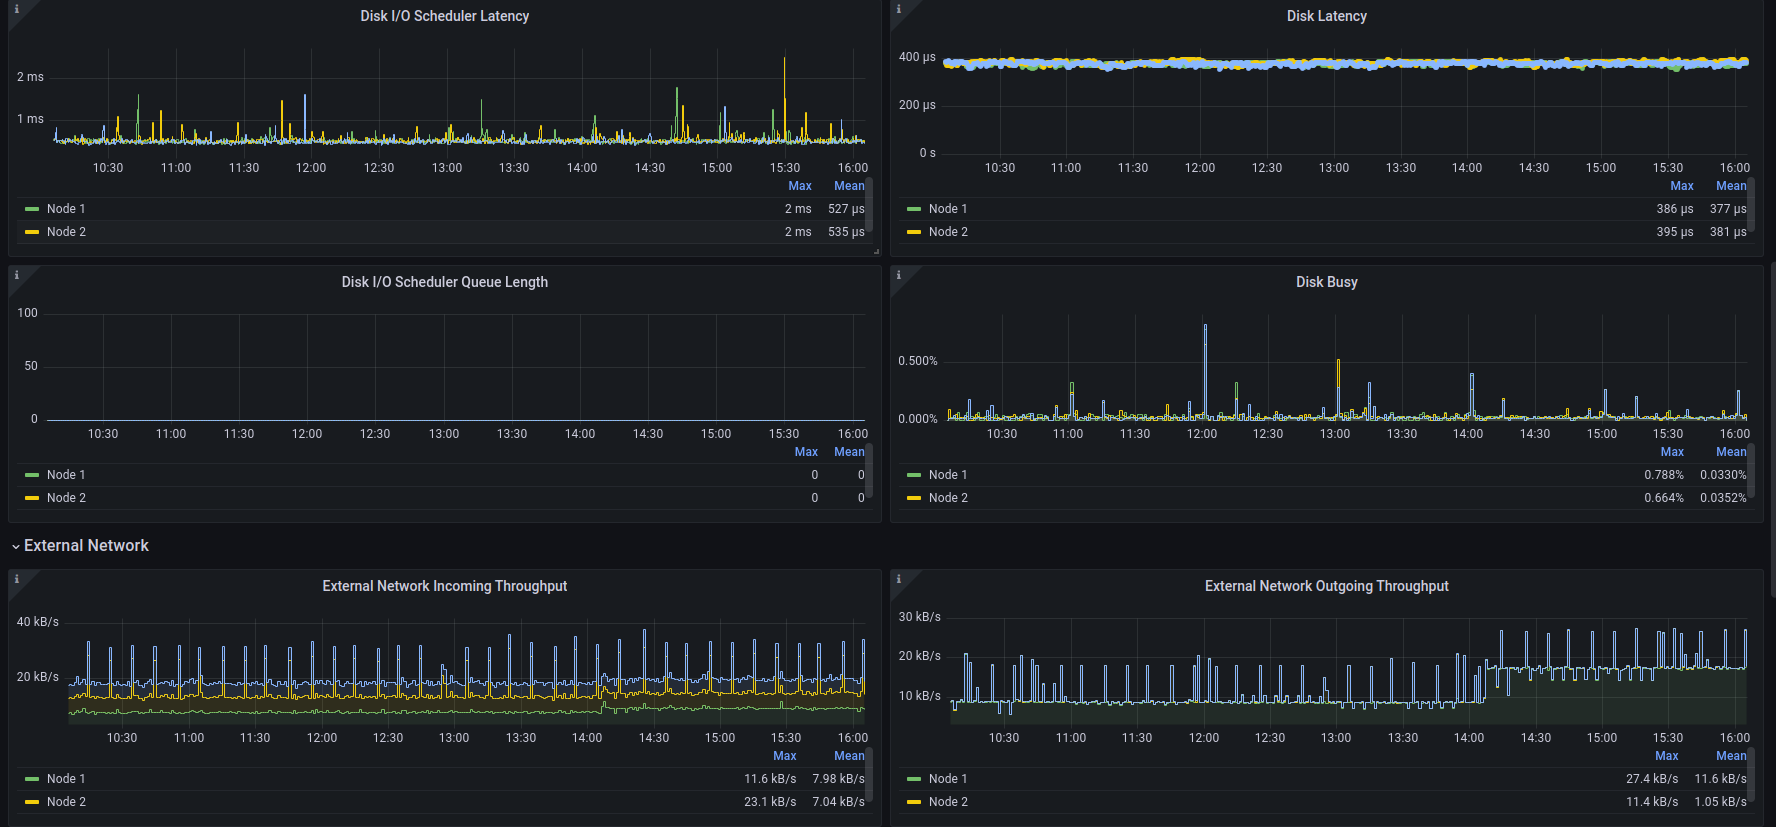
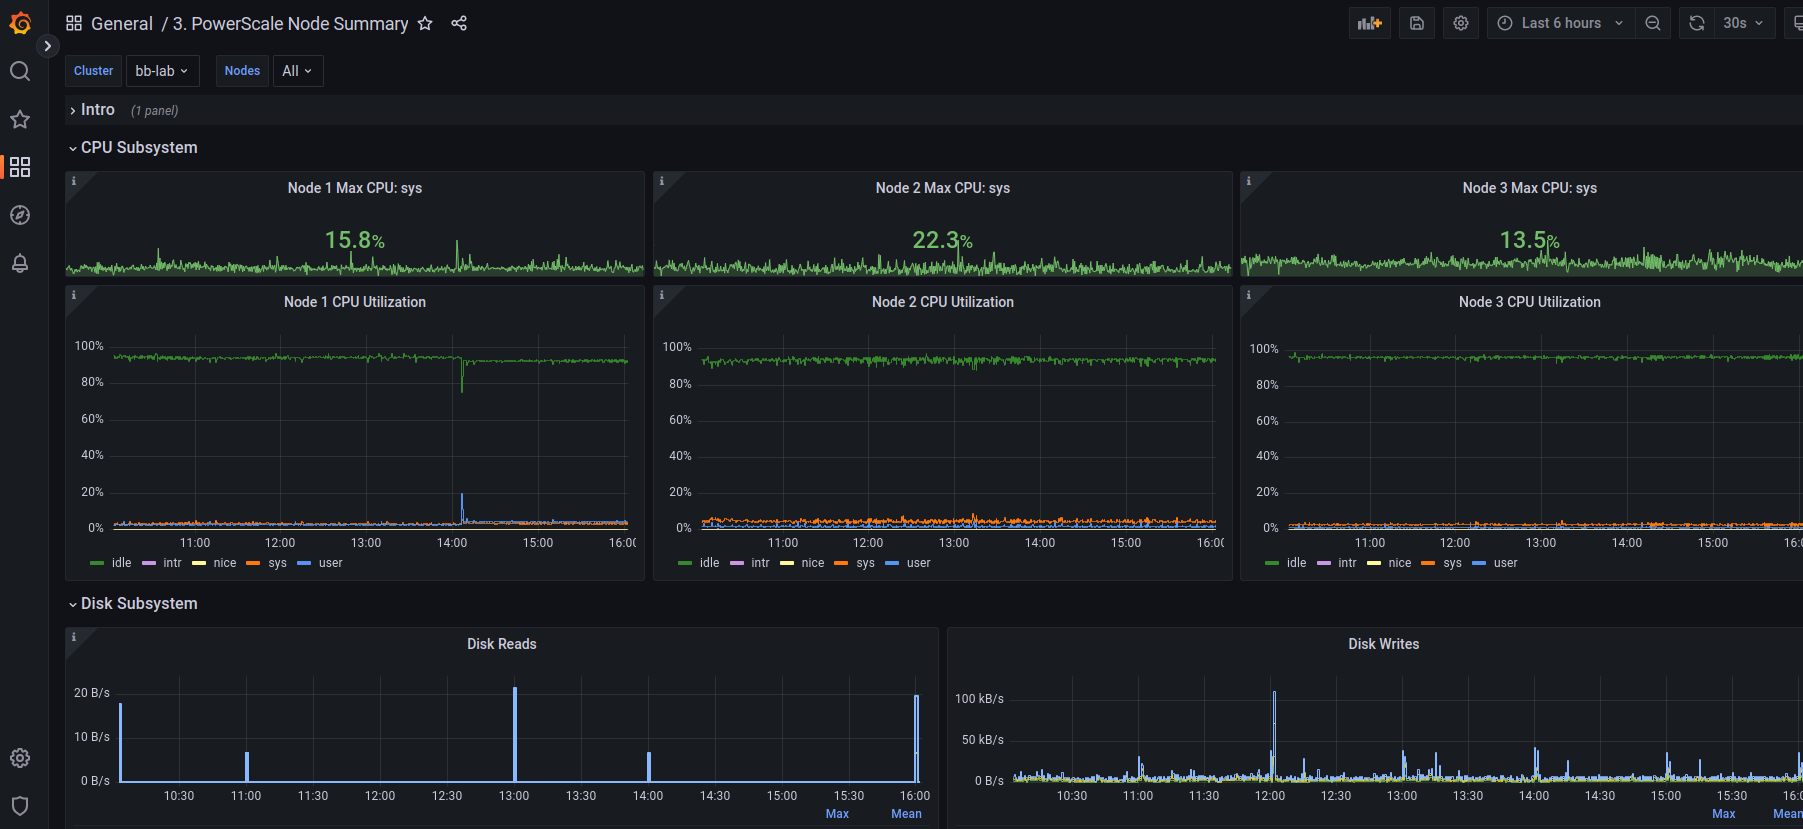
3. PowerScale Node Summary
This dashboard provides the metrics that are particular to a node.
This is base dashboard that represents the node specific metrics interesting to developers and admins. Part of the Isilon Data Insights connector package. There are several flavors of it: Original is here: https://github.com/Isilon/isilon_data_insights_connector Next Gen: https://github.com/tenortim/gostats Containerized: https://github.com/j-sims/idi
They can be directly imported into Grafana like any other dashboard. Look back here for updates, they will happen monthly.
Data source config
Collector config:
Upload an updated version of an exported dashboard.json file from Grafana
| Revision | Description | Created | |
|---|---|---|---|
| Download |
Linux Server
Monitor Linux with Grafana. Easily monitor your Linux deployment with Grafana Cloud's out-of-the-box monitoring solution.
Learn more
