Sosivio Dashboard
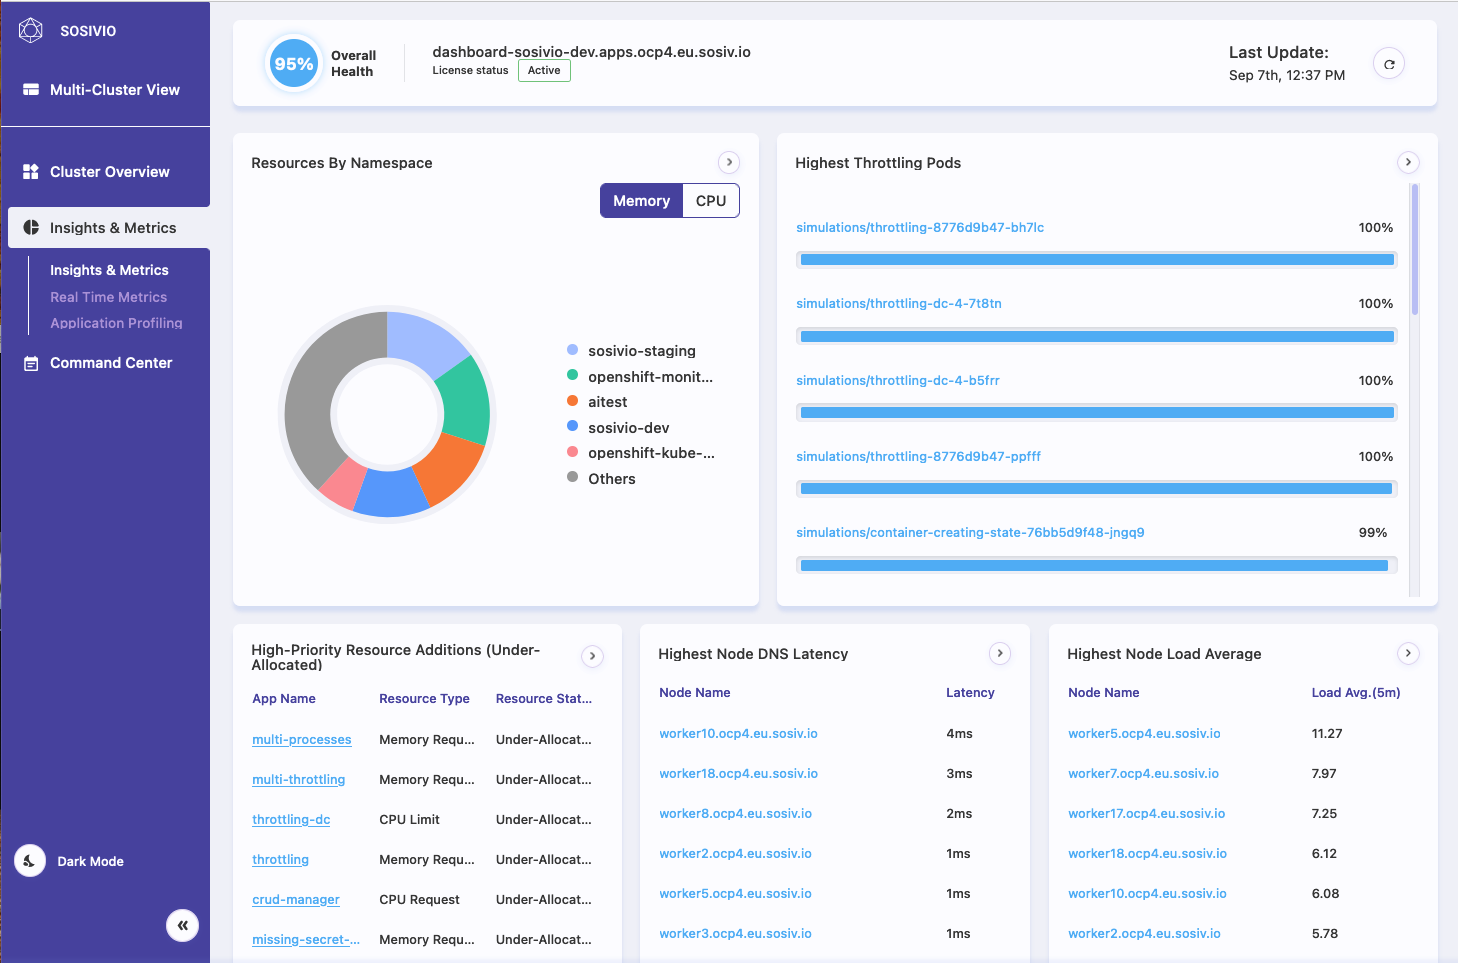
Sosivio is a predictive troubleshooting platform built specifically for Kubernetes environments and applications. Instantly start observing all flavors of Kubernetes with real-time metrics, cluster health checks, and using lean AI to predict and prevent critical failure before they appear!
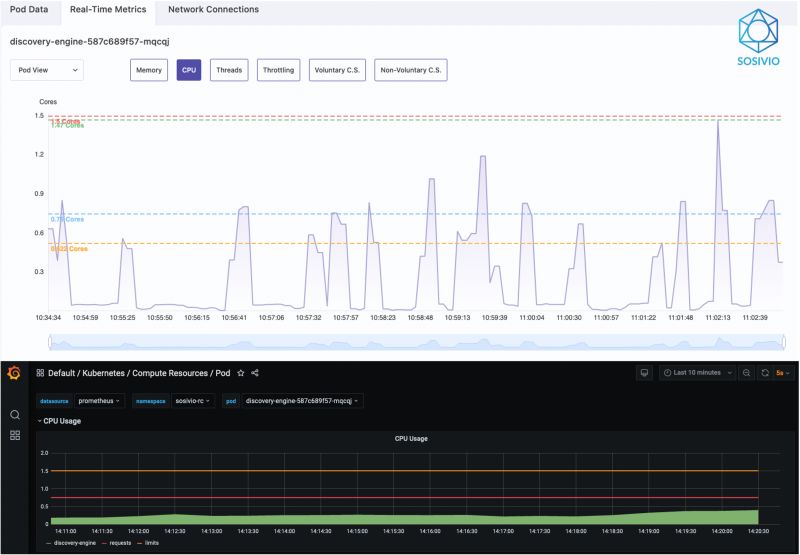
Sosivio looks at multiple layers of the infrastructure stack including the kernel, operating system, processes, network, container runtime, application logs, and Kubernetes layer. This granular data is fed through multiple AI/ML engines to determine the root cause of issues before they occur and provide instant remediation via a recommended command line fix.
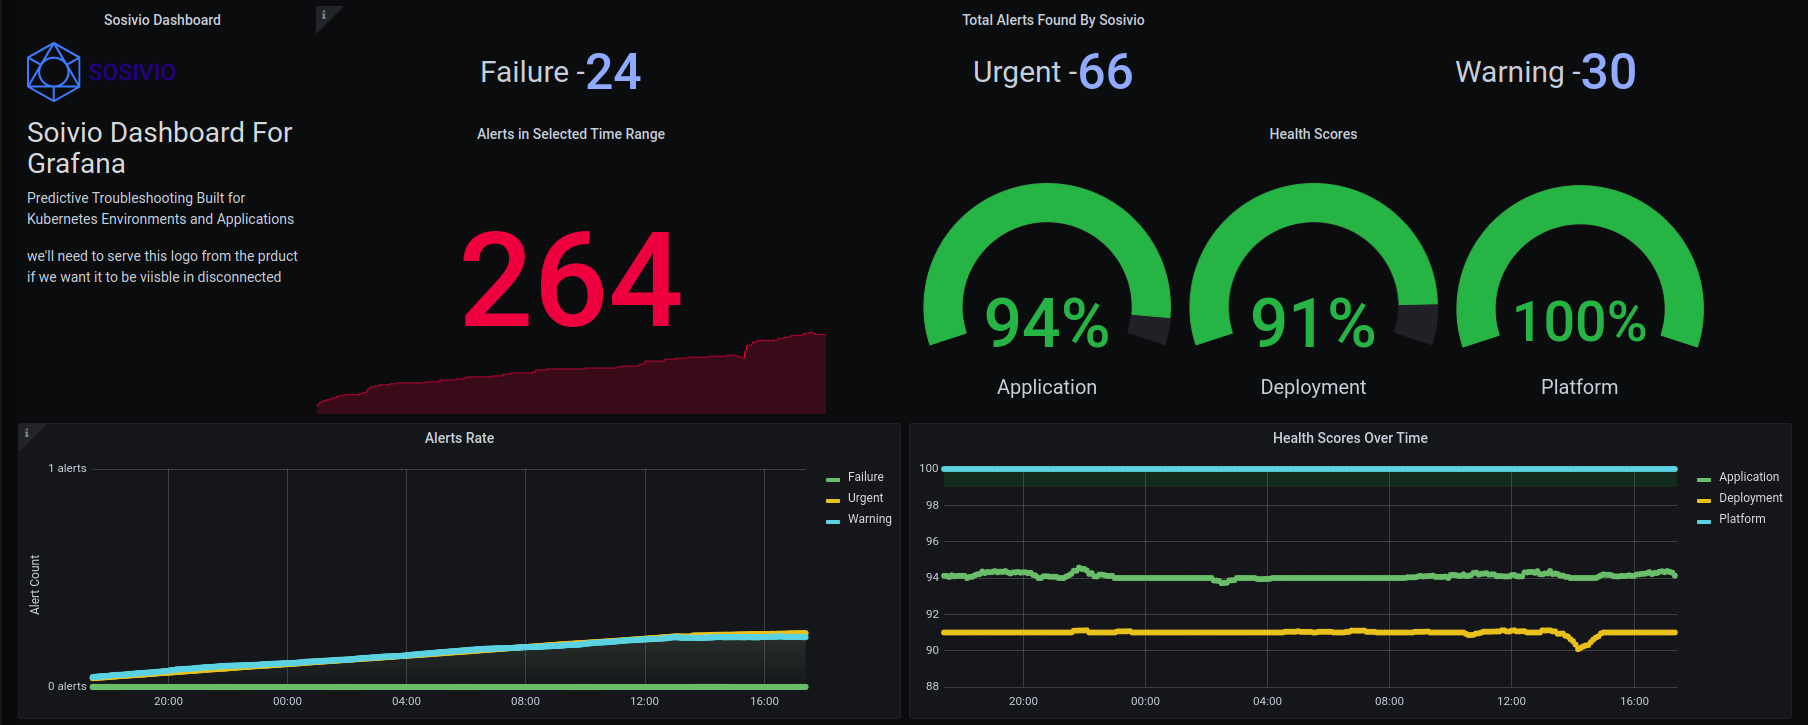
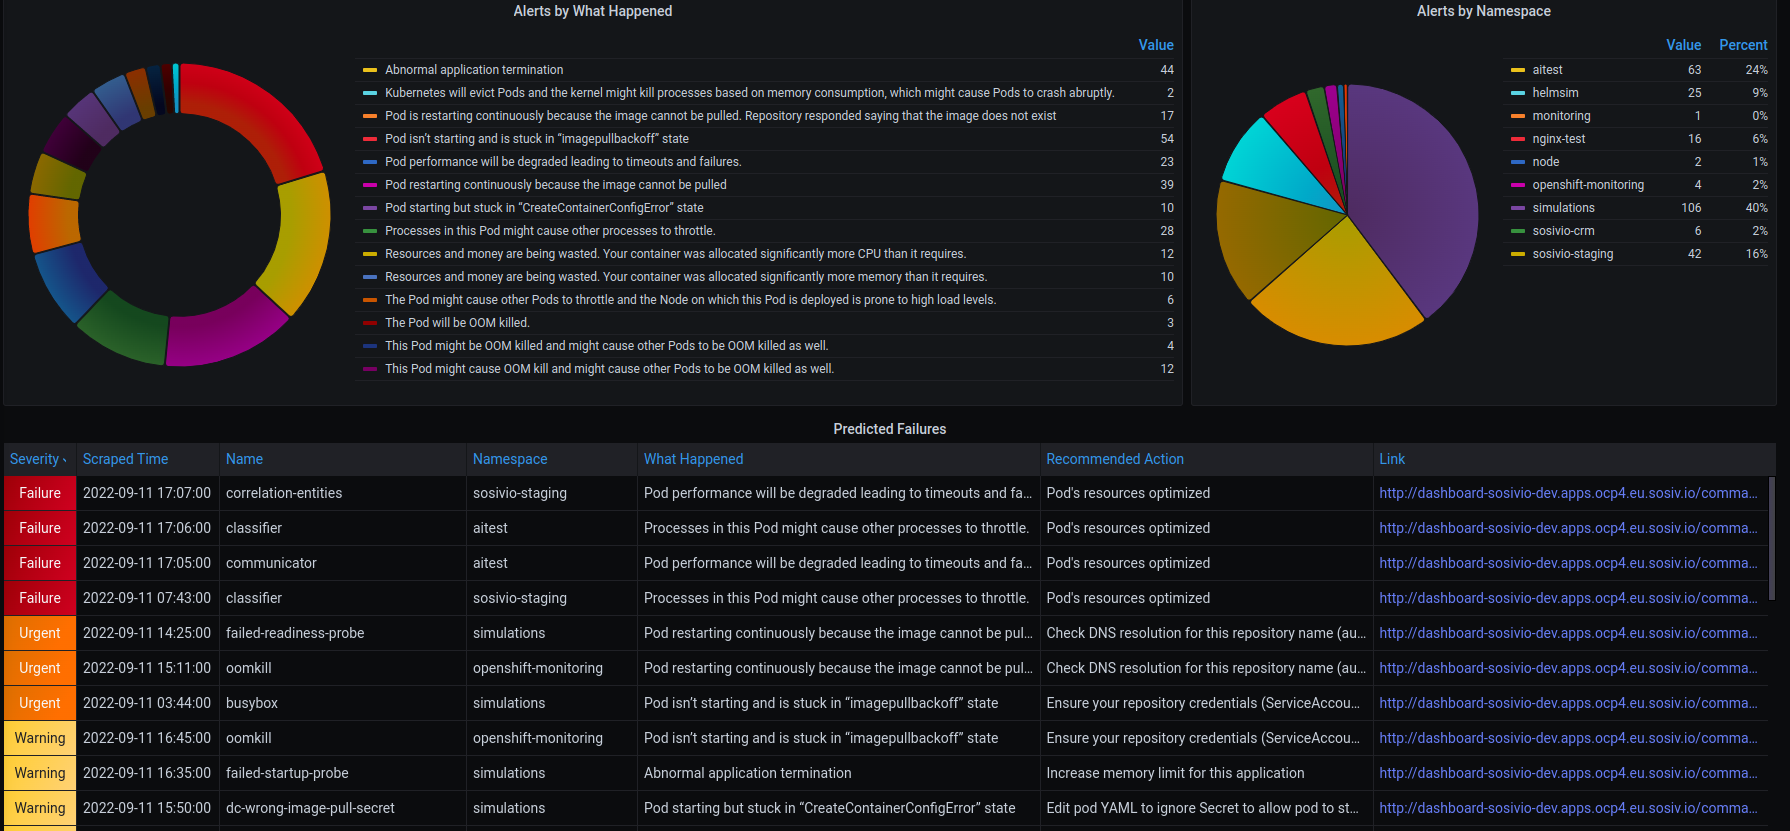
The Sosivio Dashboard for Grafana allows users to see Sosivio Failure Alerts directly in Grafana and instantly be redirected to Sosivio UI to remediate those failures. Additionally, add context around Grafana signals with Sosivio’s root cause determination for critical failures.
Installation Steps
Install Sosivio by downloading our automated installer here or refer to our documentation.
Apply the following ServiceMonitor Resource to your cluster:
apiVersion: monitoring.coreos.com/v1
kind: ServiceMonitor
metadata:
  name: sosivio
  namespace: monitoring
  labels:
    app: sosivio
spec:
  selector:
    matchLabels:
      app: notifier
  namespaceSelector:
    matchNames:
    - sosivio
  endpoints:
  - interval: 10s
    port: http
    scheme: http
if you installed sosivio in a namespace other than sosivio - change the .spec.namespaceSelector.matchNames field to your installed namespace
- Add the Sosivio Dashboard to Grafana by using the ‘Get this Dashboard’ section on this page.
Data source config
Collector config:
Upload an updated version of an exported dashboard.json file from Grafana
| Revision | Description | Created | |
|---|---|---|---|
| Download |