inspectIT - Basic Monitoring
Visualizes business metrics and technical metrics collected by inspectIT.
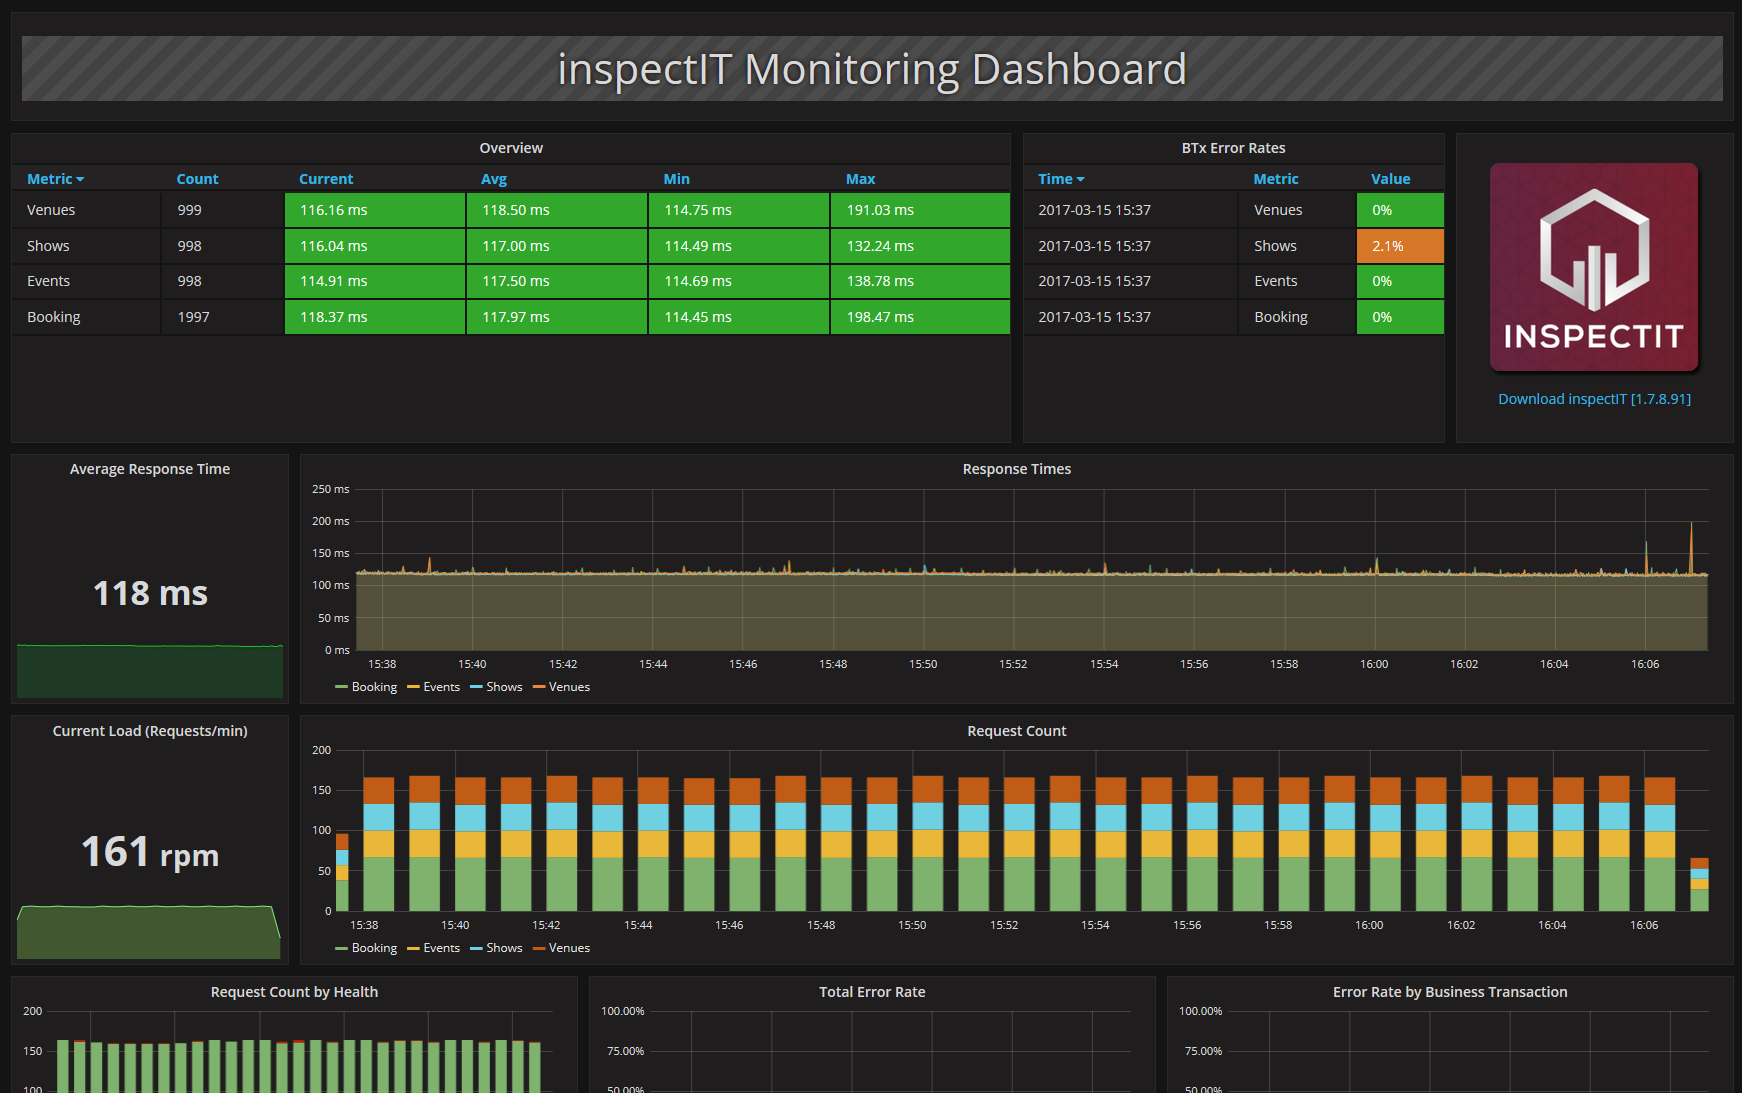
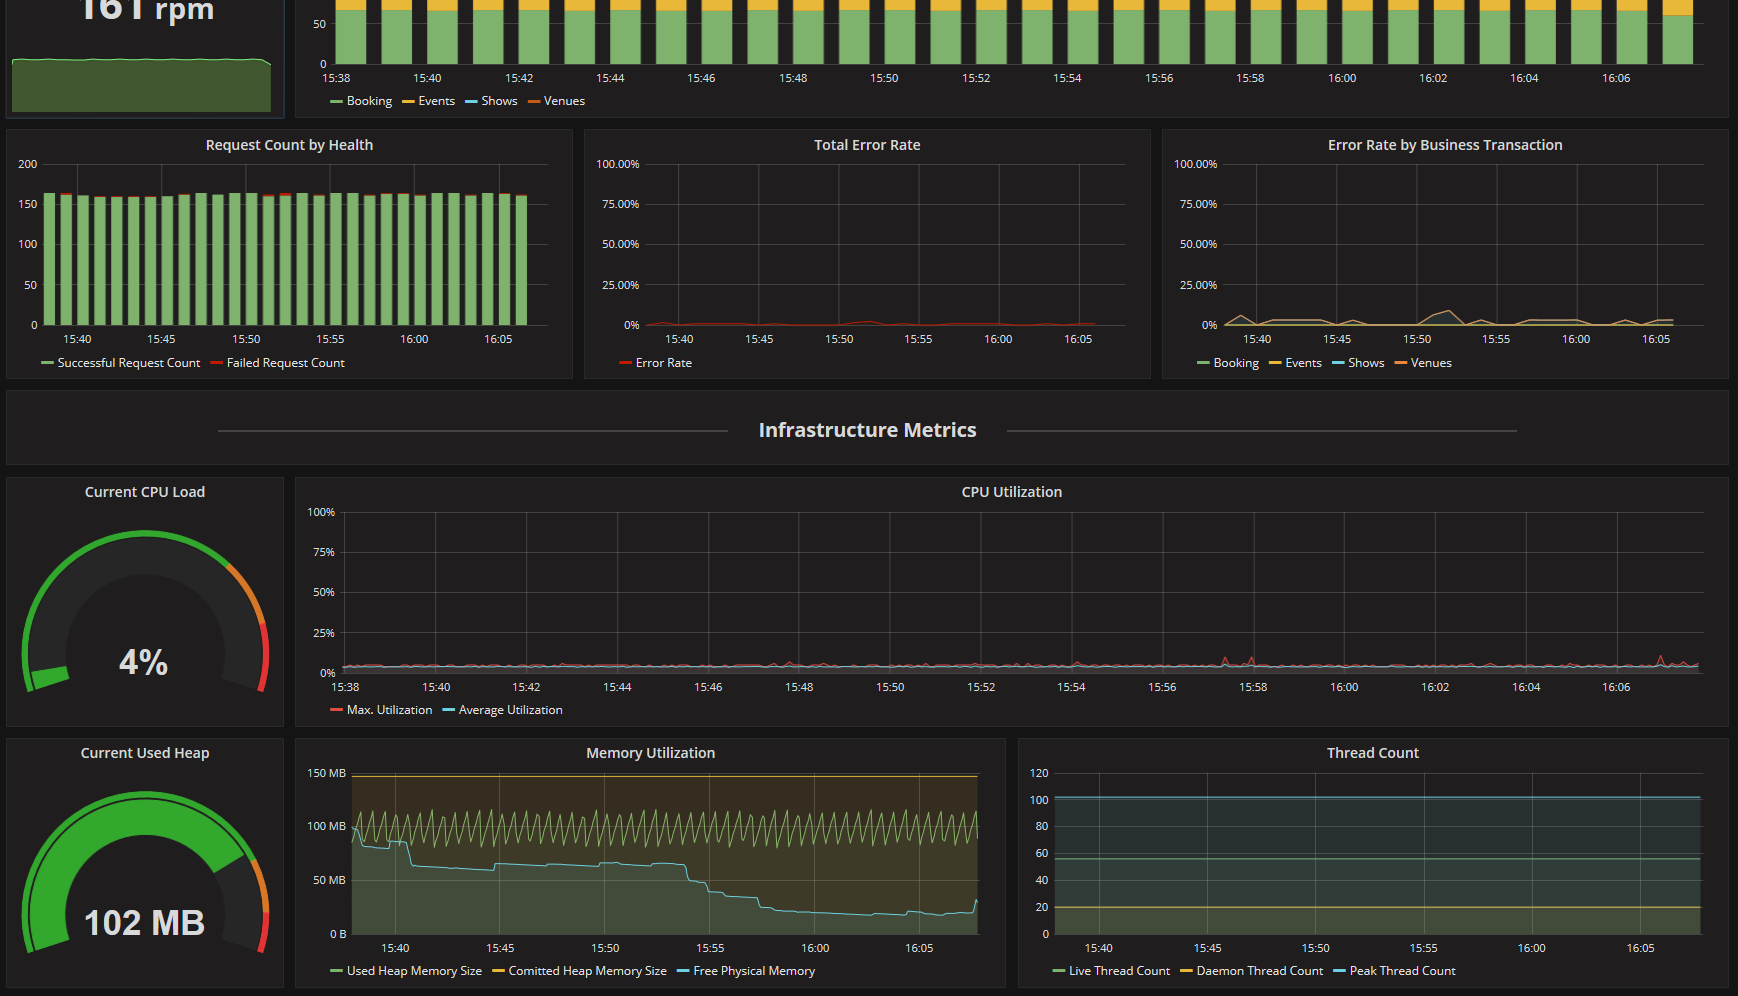
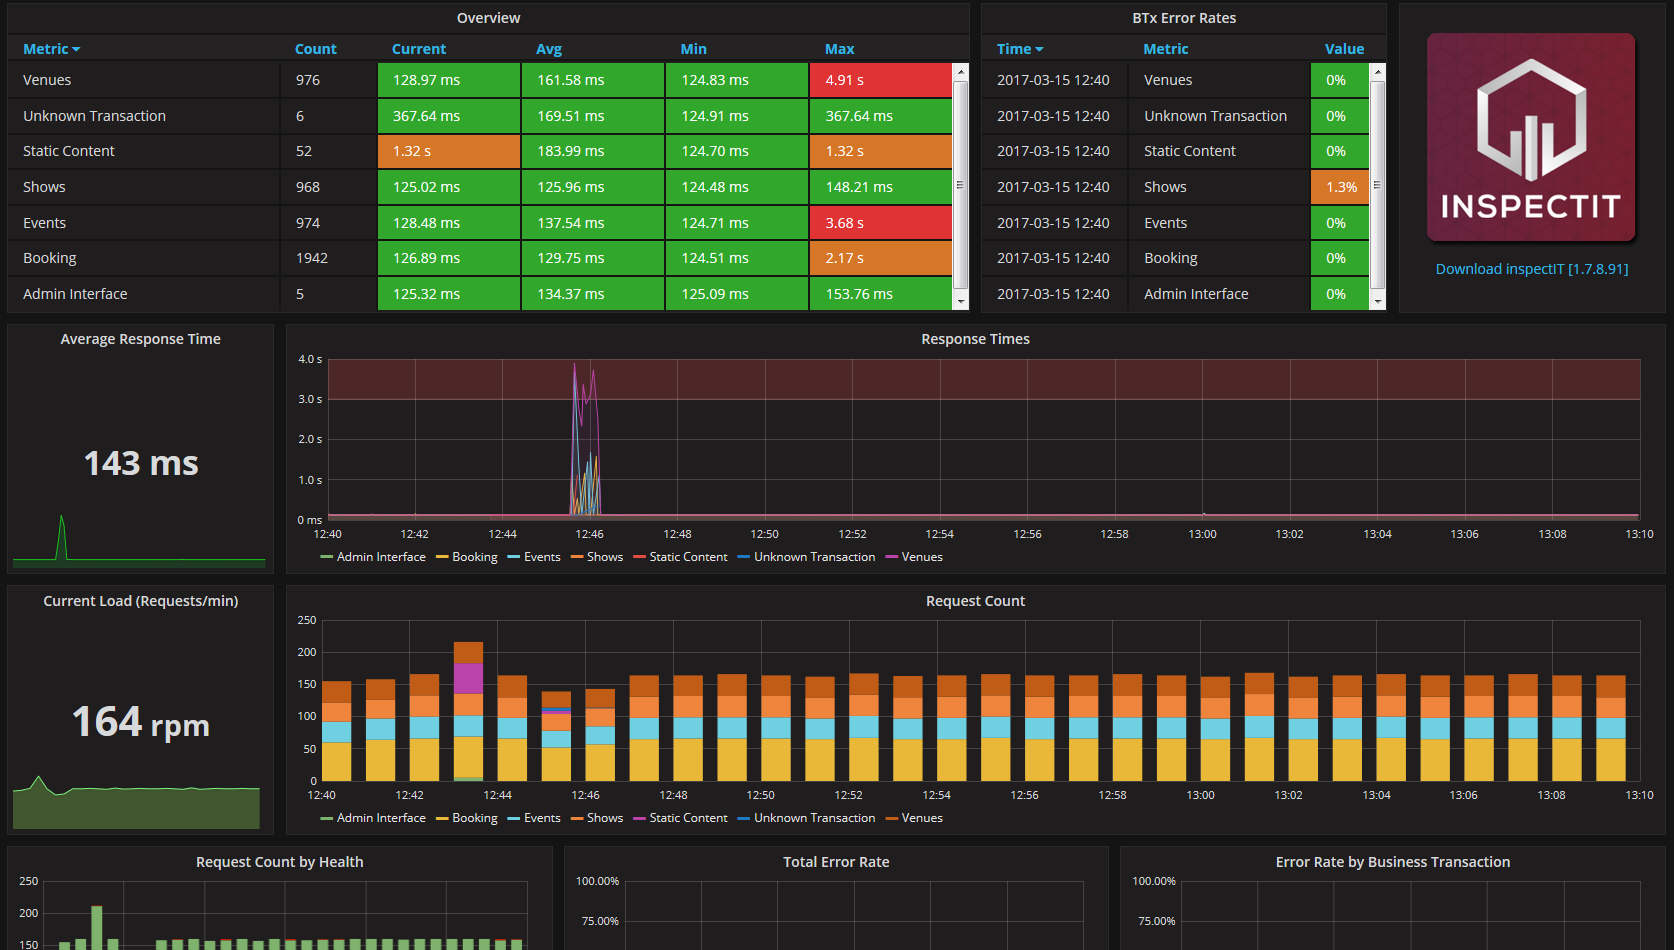
inspectIT - Basic Monitoring Data
This dashboard visualizes metrics collected by inspectIT and stored in an InfluxDB. Metrics which are related to a concrete business context as well as pure technical metrics like CPU utilization or response times are shown in this dashboard.
Using Continuous Queries error rates of web interfaces can also be displayed.
Prerequisites
To get the best experience from this dashboard, the following Continuous Queries have to be added to the used InfluxDB.
- CREATE CONTINUOUS QUERY cq_c_ok ON inspectit BEGIN SELECT count("duration") AS count_ok INTO inspectit.autogen.cq_stats FROM inspectit.autogen.businessTransactions WHERE httpResponseCode < 400 GROUP BY time(1m), businessTxName END
- CREATE CONTINUOUS QUERY cq_c_total ON inspectit BEGIN SELECT count("duration") AS count_total INTO inspectit.autogen.cq_stats FROM inspectit.autogen.businessTransactions GROUP BY time(1m), businessTxName END
- CREATE CONTINUOUS QUERY cq_ok_ratio ON inspectit BEGIN SELECT max(count_ok) / max(count_total) AS ratio_ok INTO inspectit.autogen.cq_stats FROM inspectit.autogen.cq_stats GROUP BY time(1m), businessTxName END
Data source config
Collector type:
Collector plugins:
Collector config:
Revisions
Upload an updated version of an exported dashboard.json file from Grafana
| Revision | Description | Created | |
|---|---|---|---|
| Download |