Cloud Cross-environments Management
Dashboard to be used on multiple cloud environments
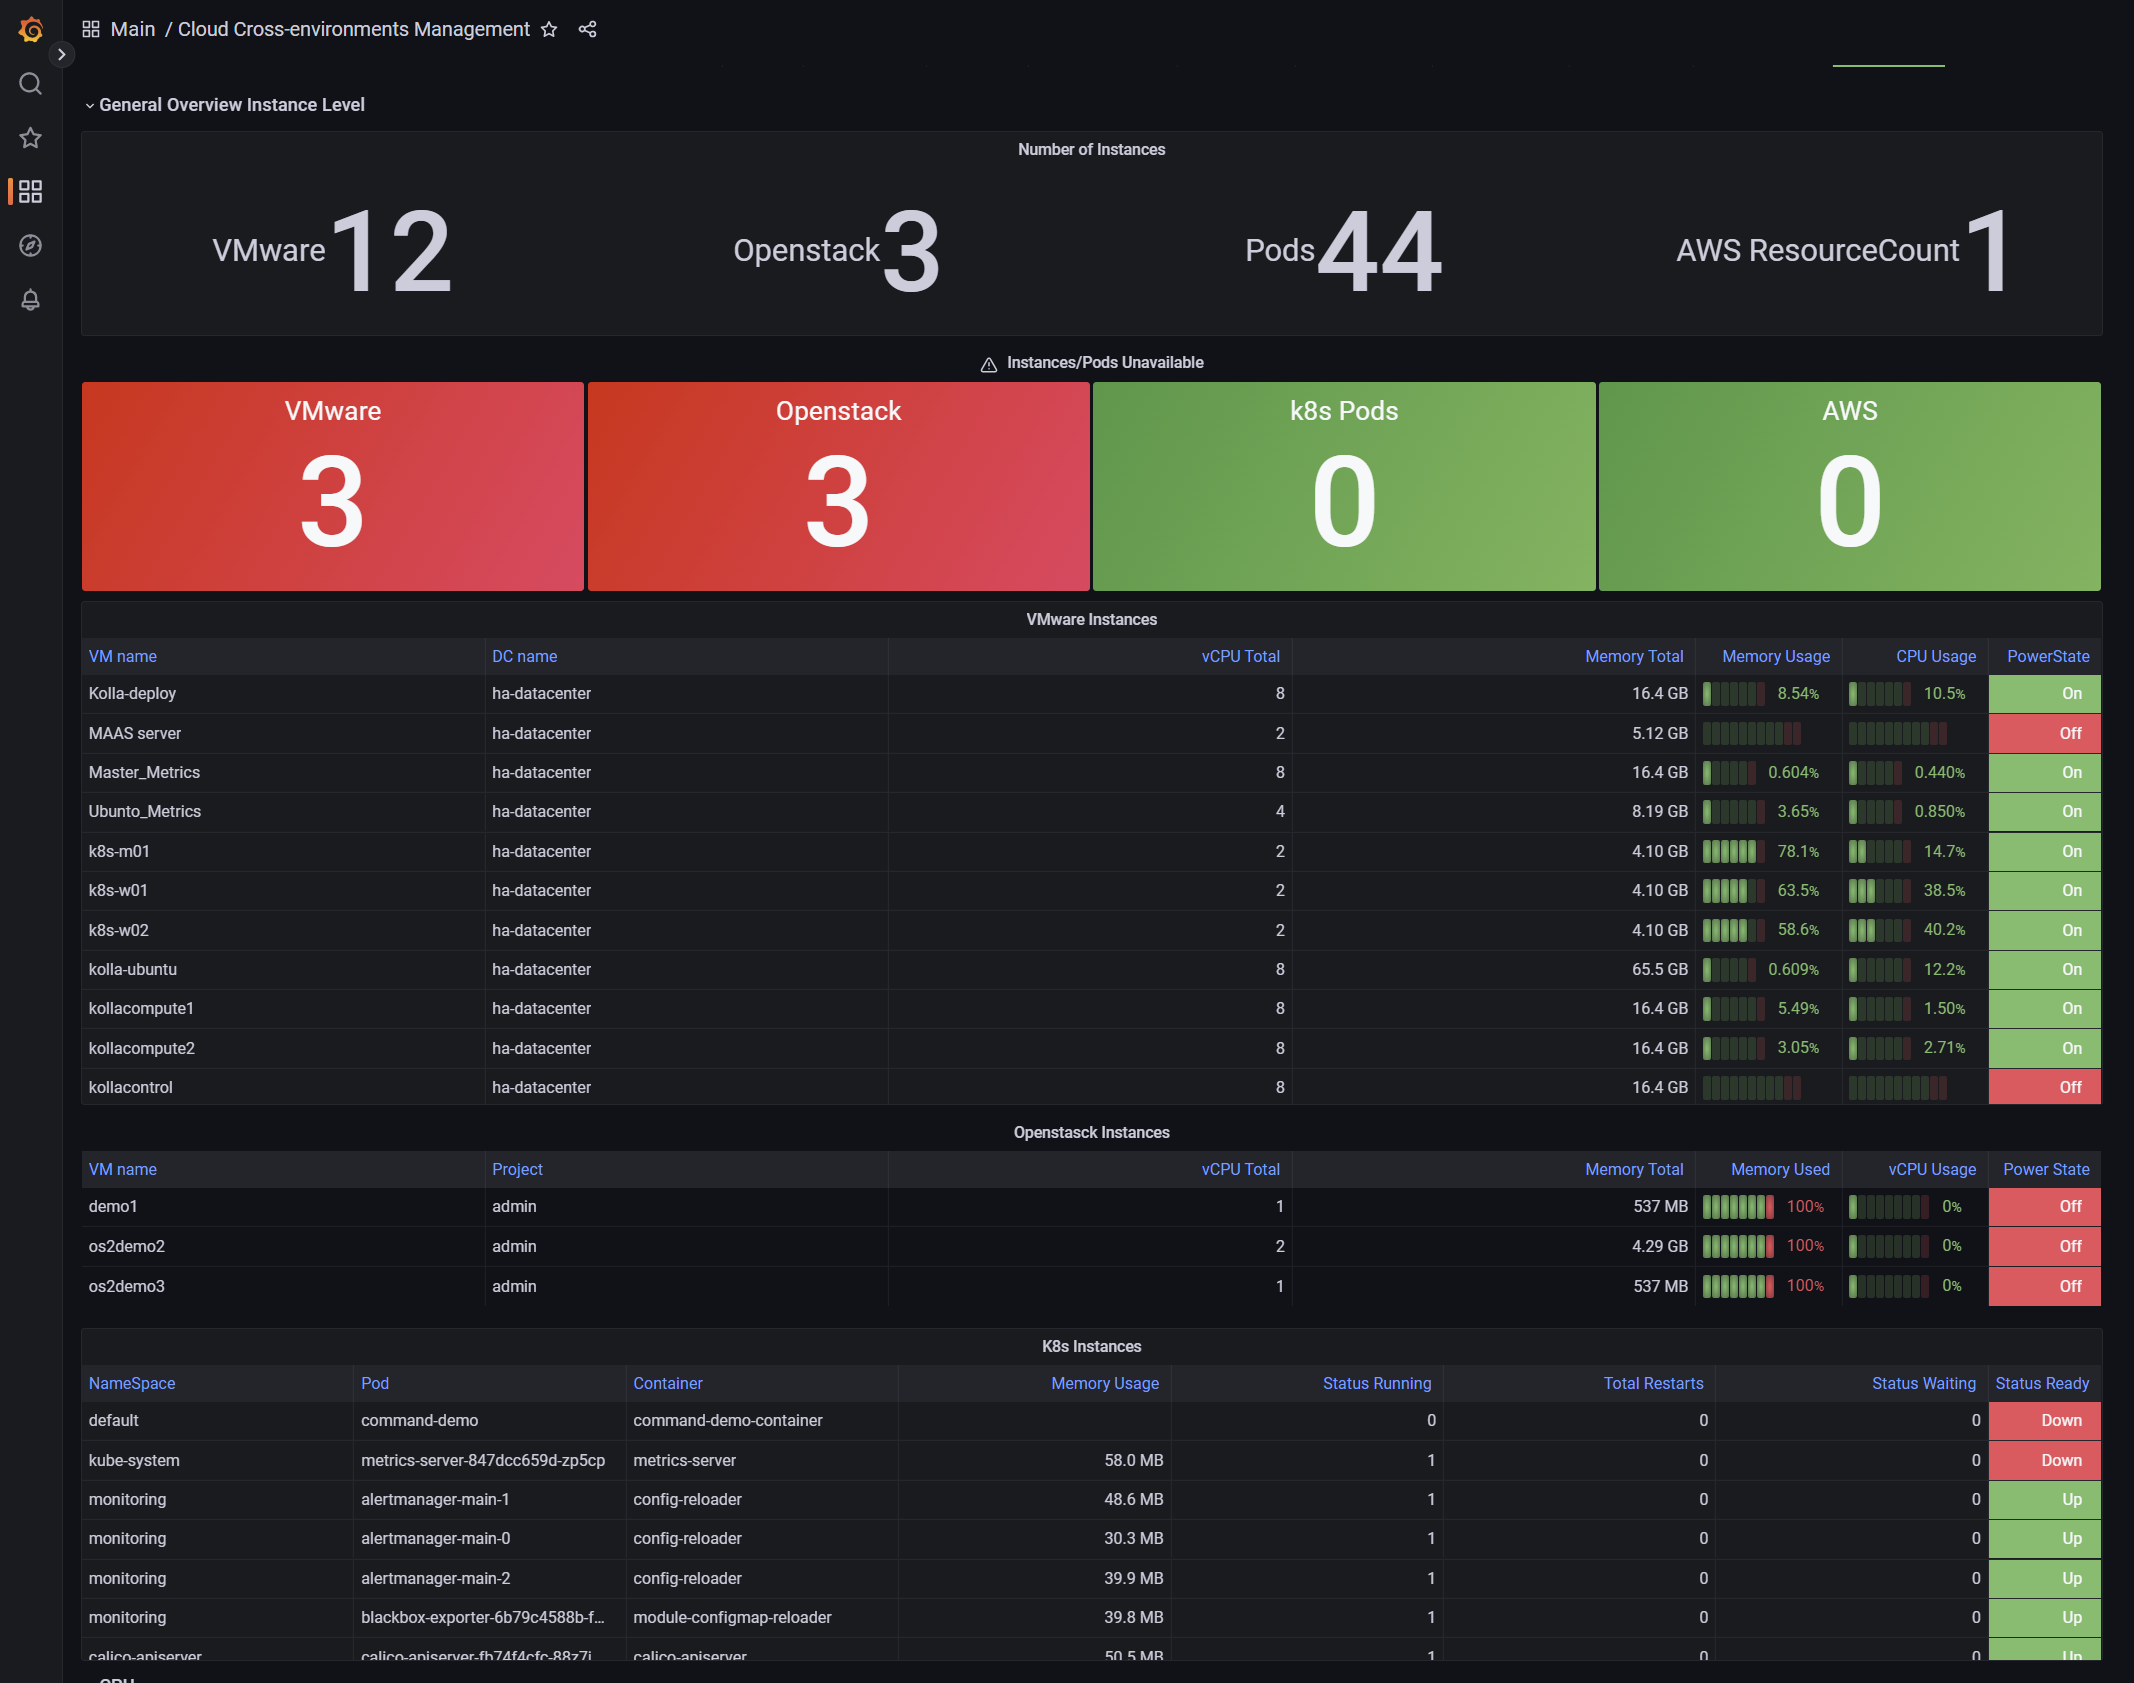
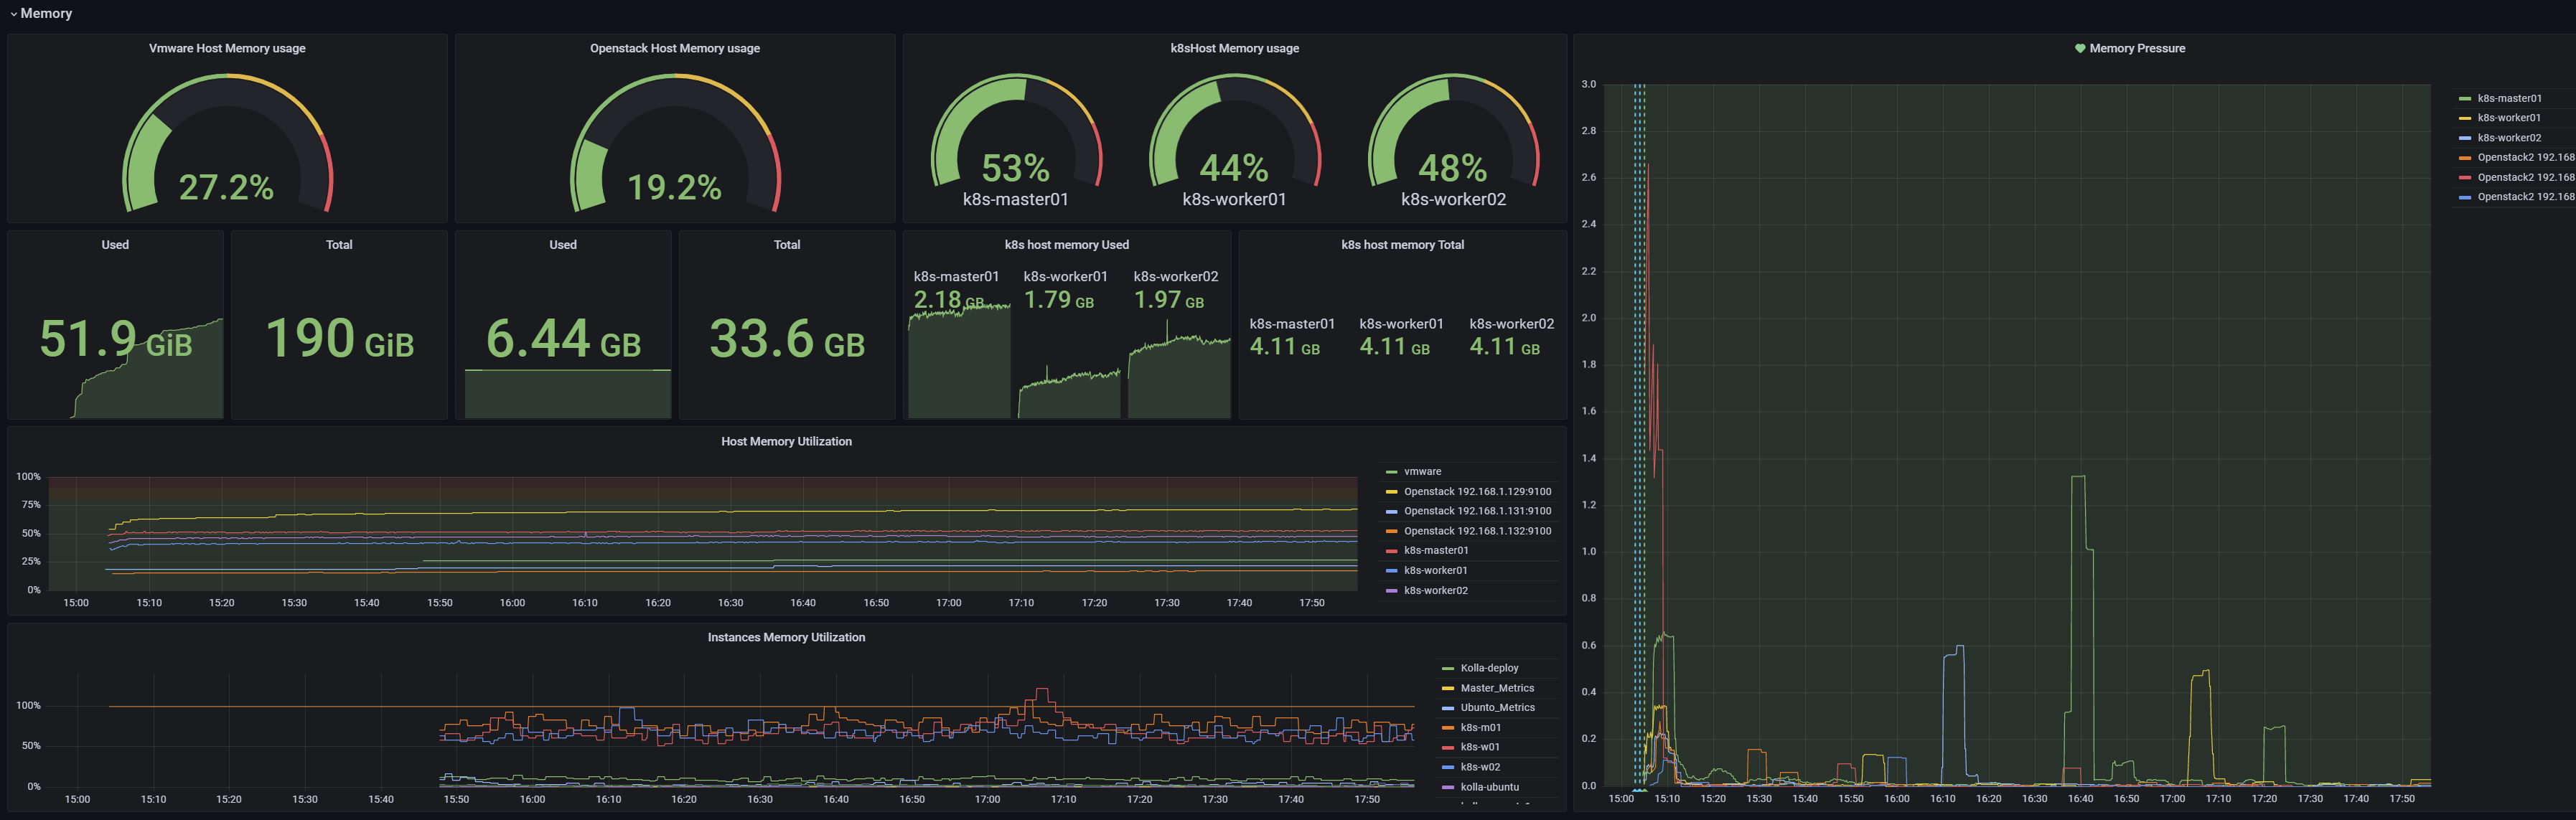
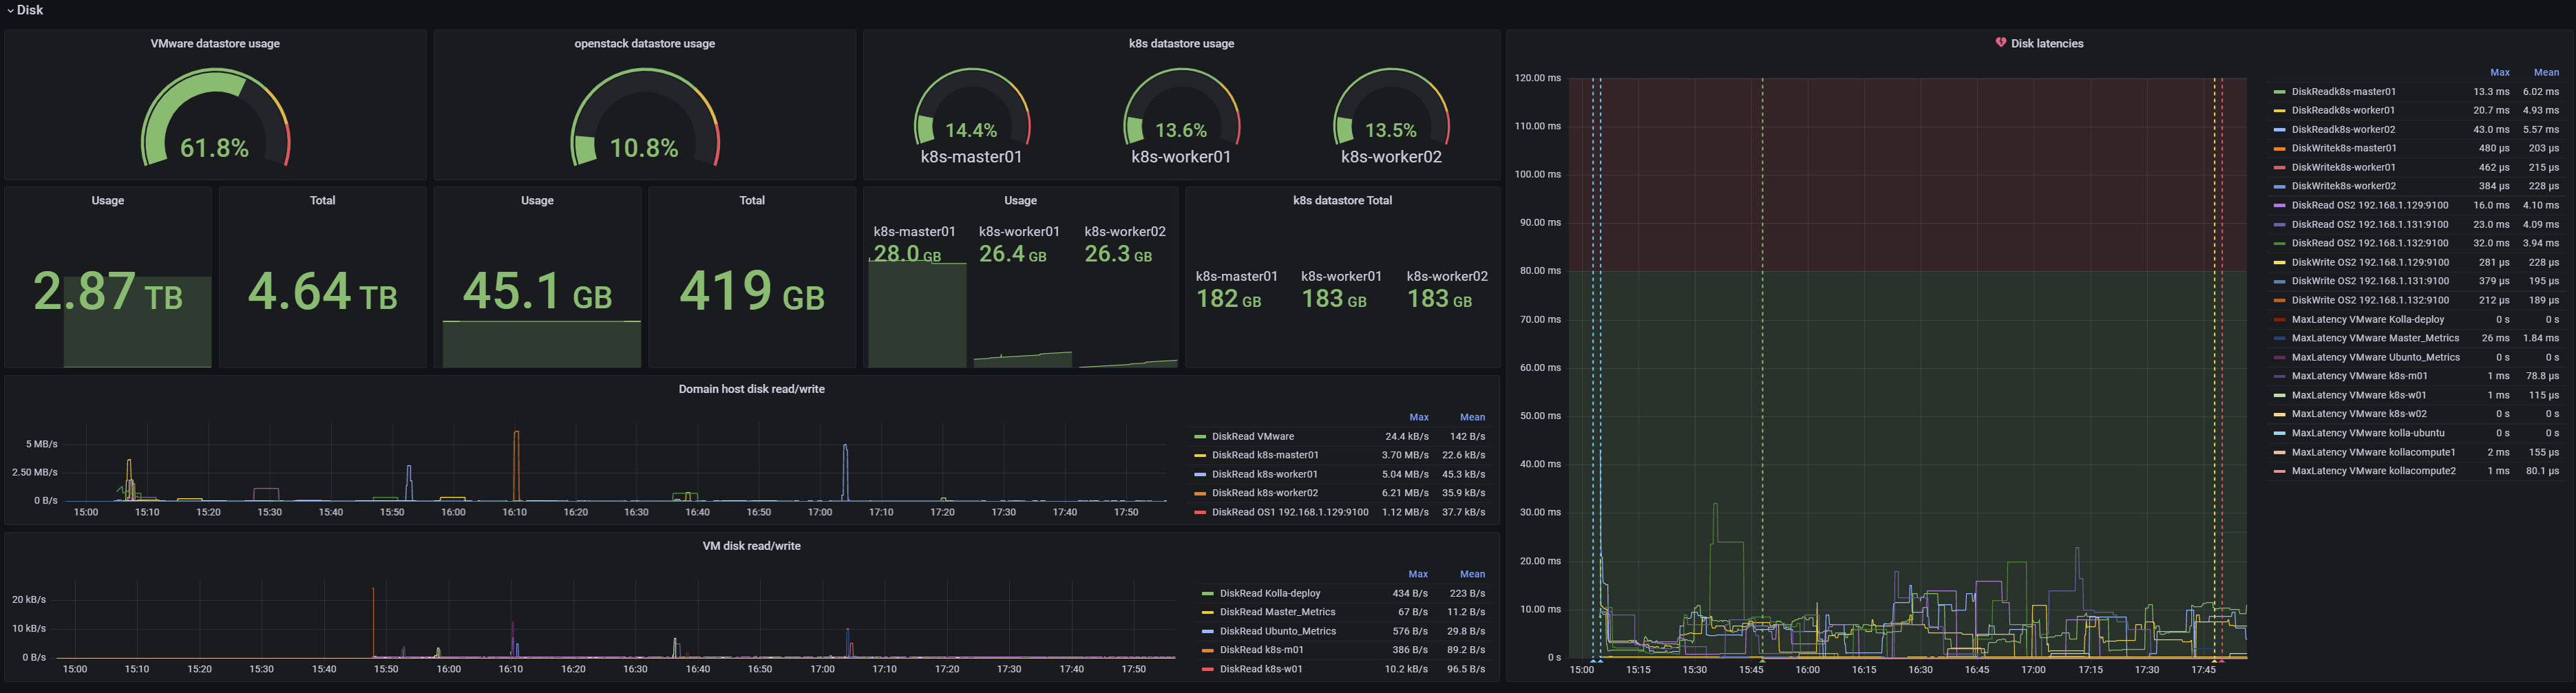
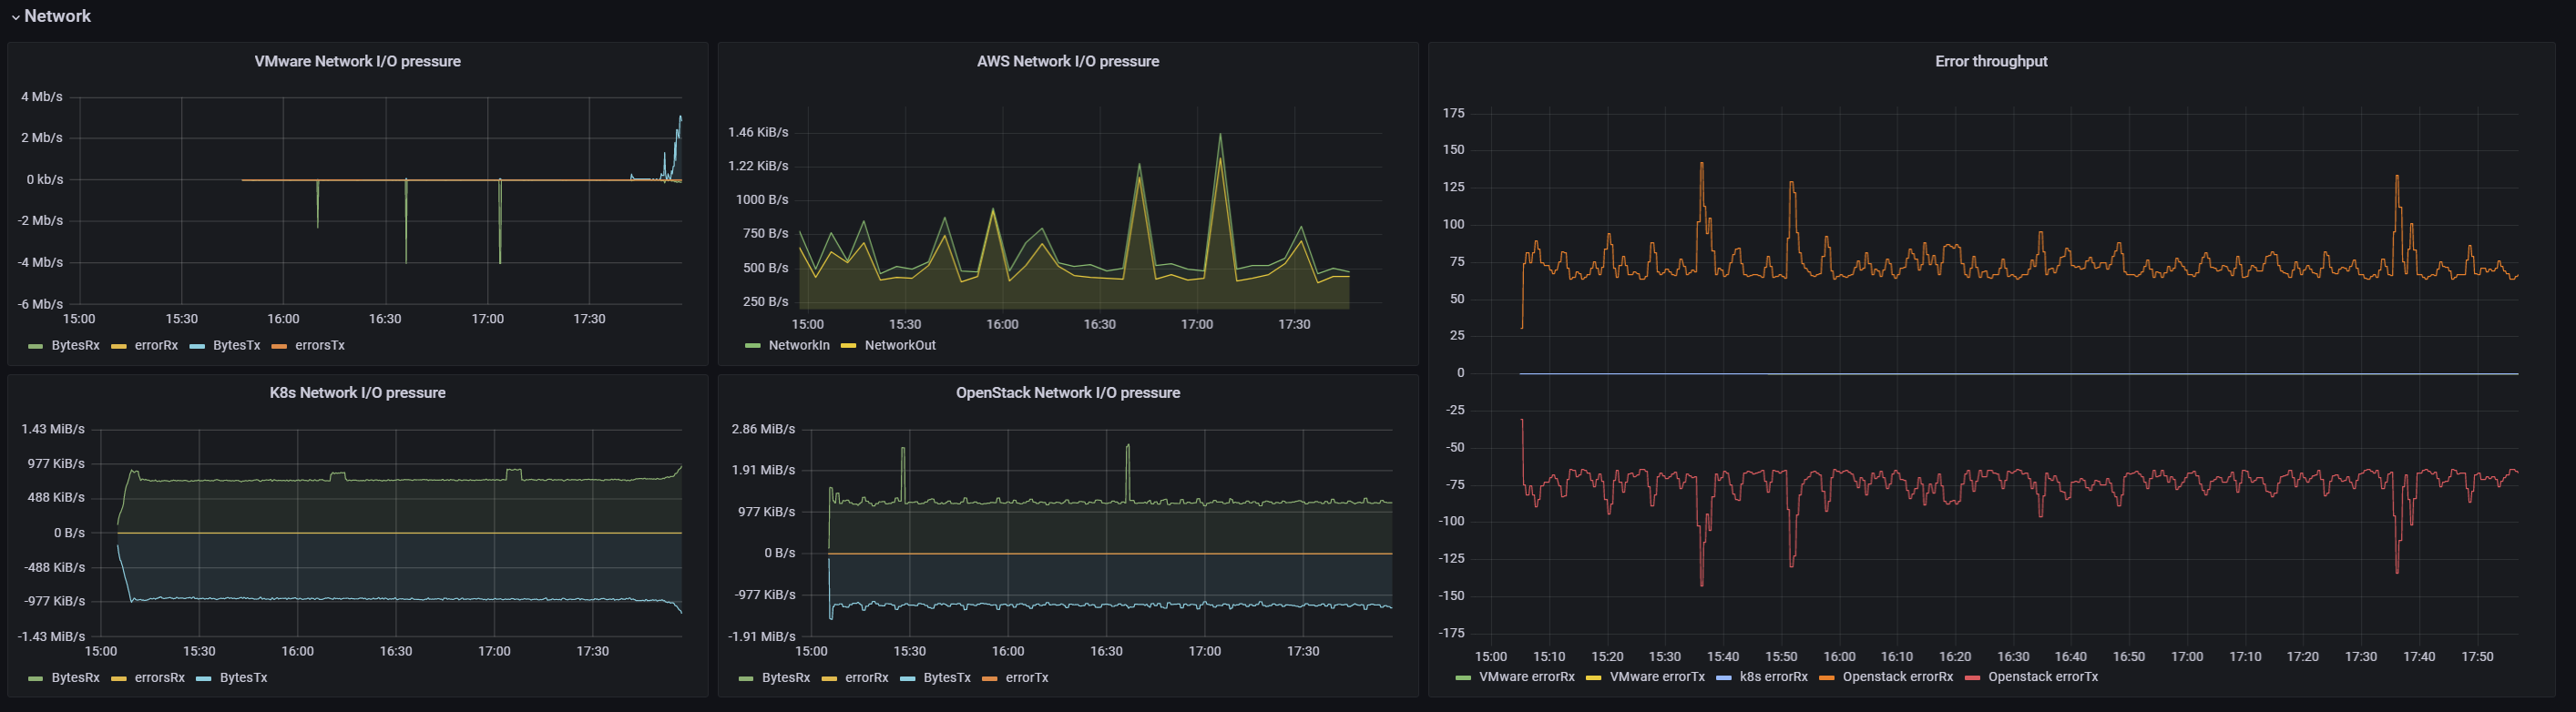
This dashboard was developed as part of a Master Thesis to handle the complexity of multiple and diverse environments. I tried as much to present data simply and clearly. For practical analysis and troubleshooting, data is presented in a hierarchy view, showing a systems summary and then detailed for each resource. It is advisable to complement with alert rules definition on Prometheus level.
Data source config
Collector type:
Collector plugins:
Collector config:
Revisions
Upload an updated version of an exported dashboard.json file from Grafana
| Revision | Description | Created | |
|---|---|---|---|
| Download |