Kubernetes Morning Dashboard (Cluster - Pod lists - Portworx)
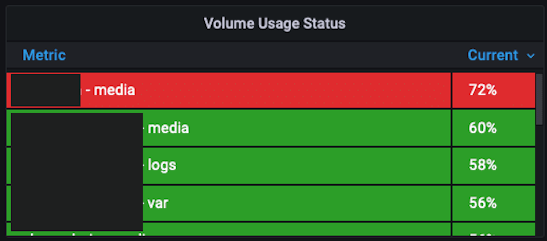
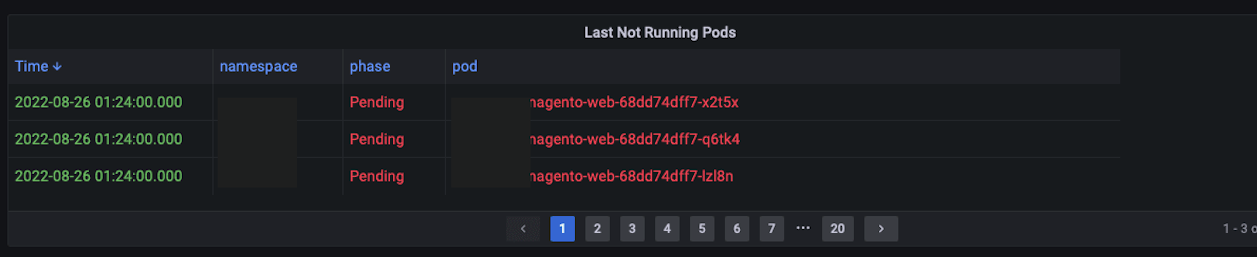
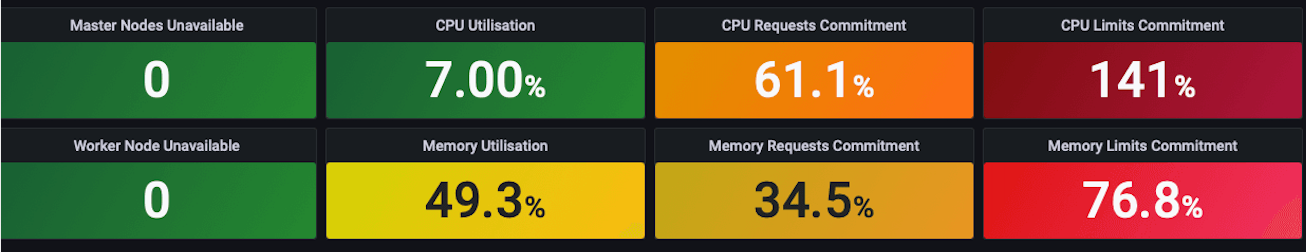
Kubernetes Unavailable list (master,worker) Kubernetes cluster cpu,mem (util,req,limits) Last not running pod Iist (by time) Kubernetes Cluster cpu util by namespace and node Kubernetes Cluster mem util by namespace and node Top cpu used pods, Top mem used pods, Portworx volume usage (label replace; pvcname - namespace)
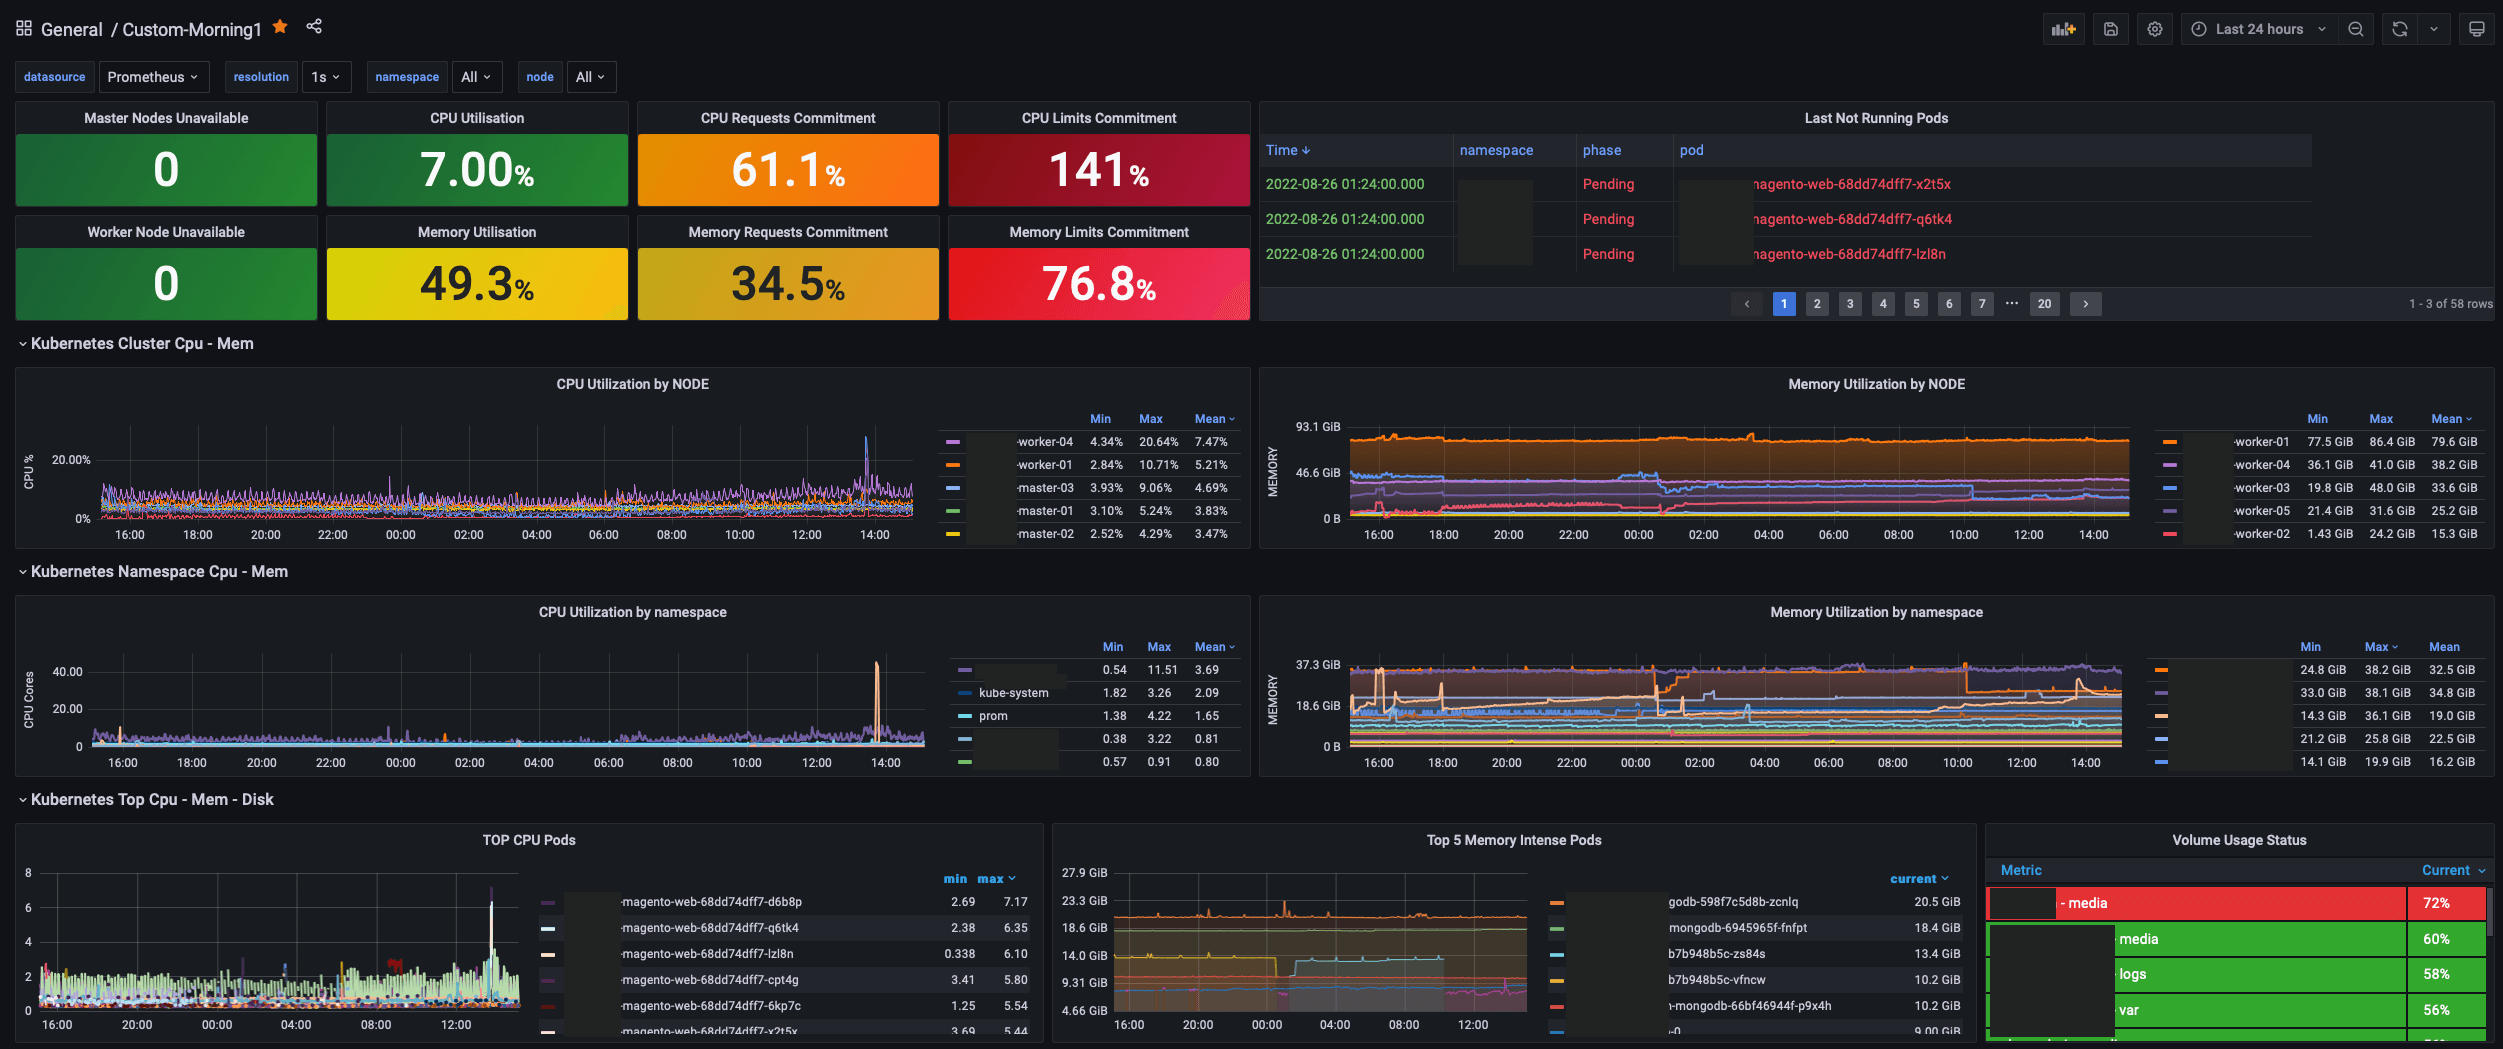
The Kubernetes Morning Dashboard (Cluster - Pod lists - Portworx) dashboard uses the prometheus data source to create a Grafana dashboard with the graph, stat, table, table-old and timeseries panels.
Data source config
Collector type:
Collector plugins:
Collector config:
Revisions
Upload an updated version of an exported dashboard.json file from Grafana
| Revision | Description | Created | |
|---|---|---|---|
| Download |
Kubernetes
Monitor your Kubernetes deployment with prebuilt visualizations that allow you to drill down from a high-level cluster overview to pod-specific details in minutes.
Learn more