APC dash pro
Monitor your APC UPS statistics.
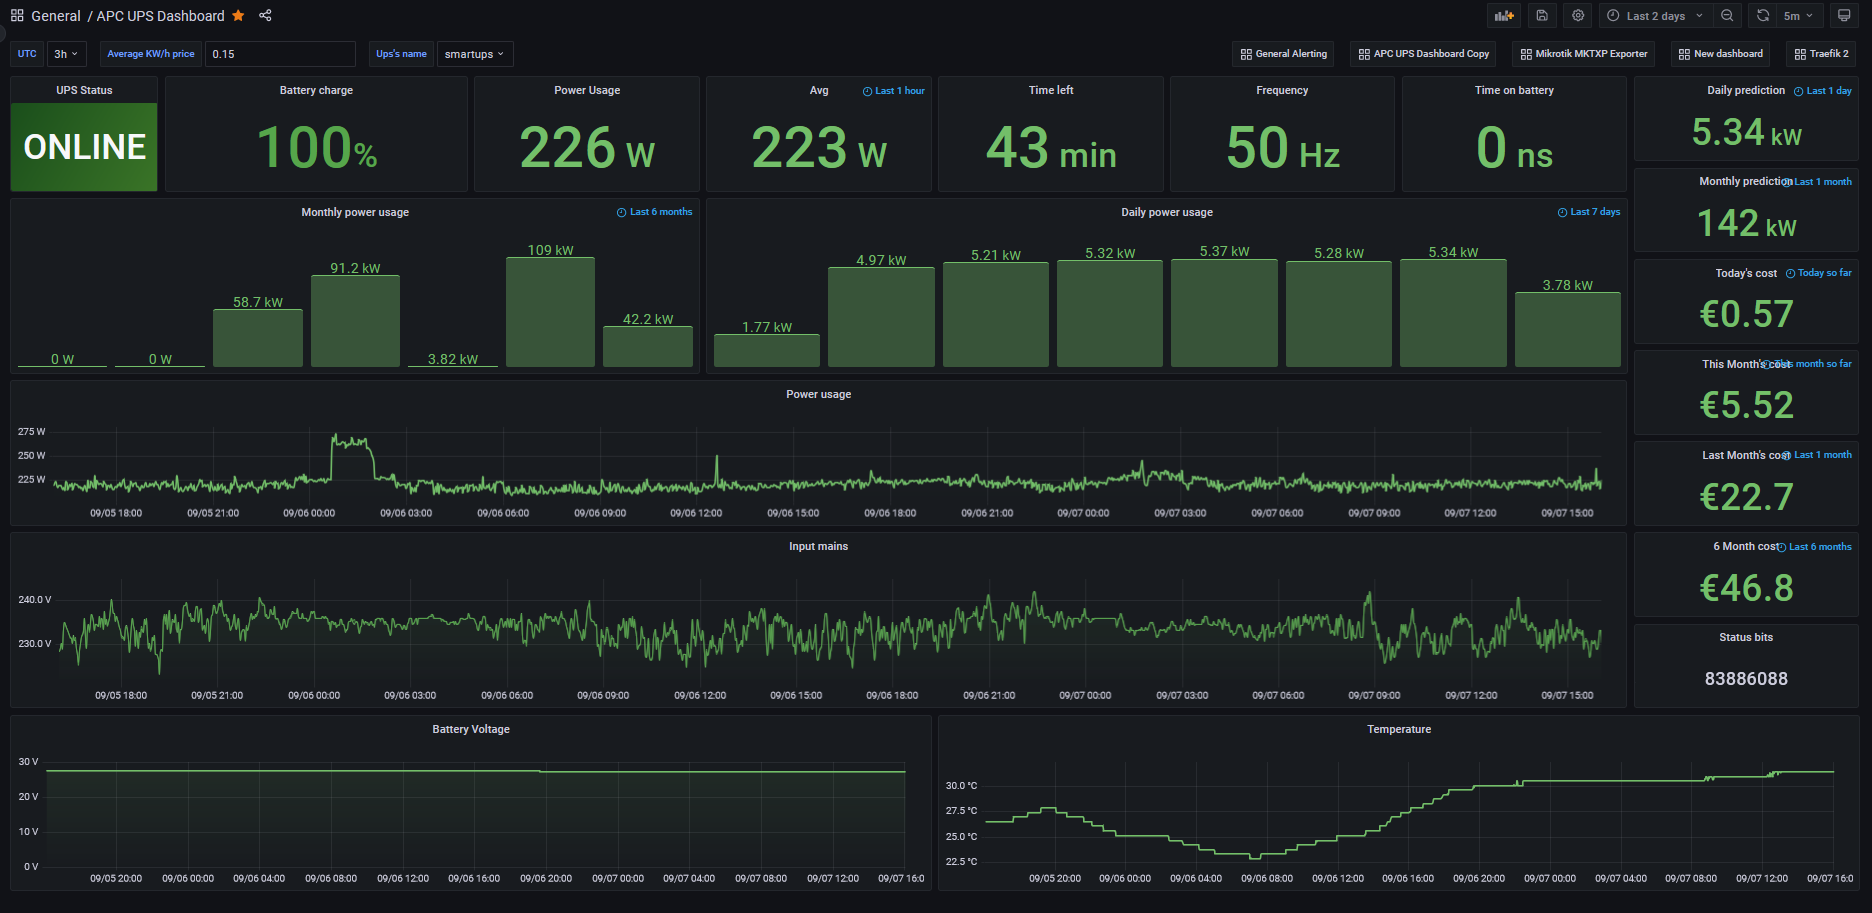
I couldn’t find a dashboard that suited my needs (for influxDB v2), so I made my own. Queries could likely be improved upon, but seem to be fine in my case. Displays all the data available from apcupsd plugin from telegraf, after importing check and update variables.
TimeZone = Time zone in UTC AvgKWprice = Price per KW/h InfluxBucket = Your buck where Telegraf saves dataUpsPower = Your UPS power rating in watts UpsName = Name of your ups in bucket, telegraf tries to find them automaticallyInfluxBucket = Original bucketInfluxBucket_ds = Downsampled bucketDownsample_len = Retention time of InfluxBucket
Features:
- Dynamicly displays data from downsampled and original bucket
- Finds all UPS's in bucket
- Timezones, to correct for
window()offsett - Data displayed:
- Monthly power usage (smoothed, daily) + prediction, cost
- Daily power usage (smoother, hourly) + prediction, cost
- Live power usage
- In and Out AC voltage
- Battery voltage and temperature
More info in GitHub.
Logo is not mine, but was royalty free.
Data source config
Collector config:
Upload an updated version of an exported dashboard.json file from Grafana
| Revision | Description | Created | |
|---|---|---|---|
| Download |