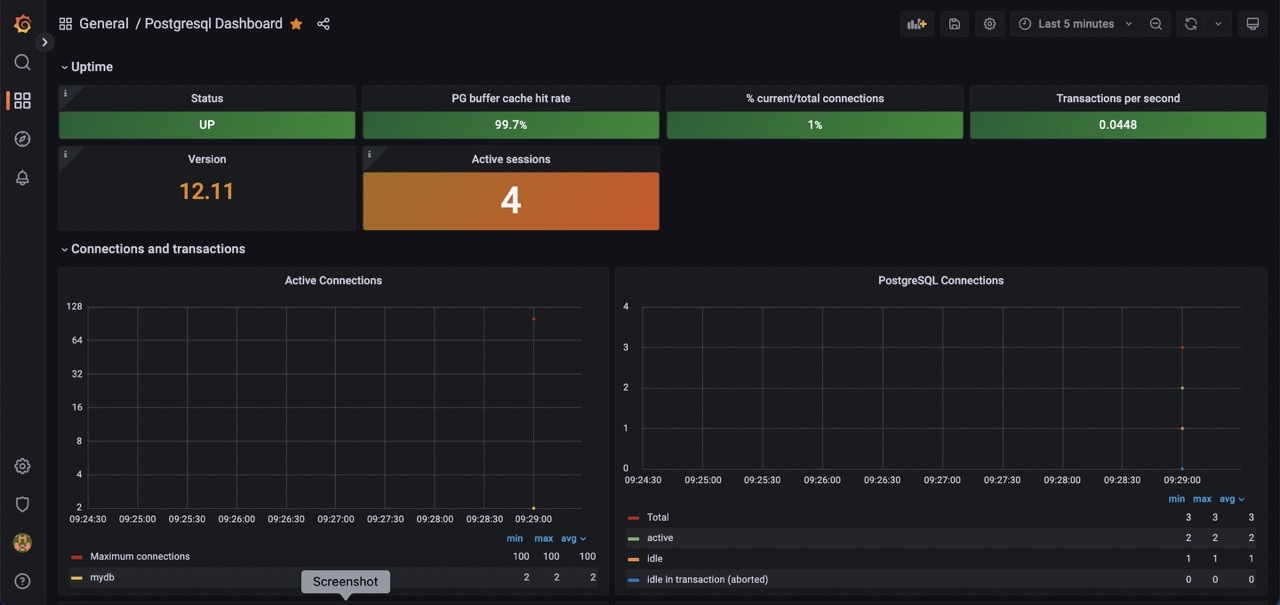
Opstree/Nginx
Grafana Dashboard for Nginx Web Server.
Installation:
Use these commands for Installation git clone https://github.com/knyar/nginx-lua-prometheus.git sudo apt-get install libnginx-mod-http-lua
Dependencies:
Add the following to the http section of nginx.conf:
sudo vi /etc/nginx/nginx.conf
Virtual Host Configs
    include /etc/nginx/conf.d/*.conf;
    include /etc/nginx/sites-enabled/*;
    lua_shared_dict prometheus_metrics 10M;
    lua_package_path "/path/to/nginx-lua-prometheus/?.lua;;";
    init_worker_by_lua_block {
      prometheus = require("prometheus").init("prometheus_metrics")
      metric_requests = prometheus:counter(
        "nginx_http_requests_total", "Number of HTTP requests", {"host", "status"})
      metric_latency = prometheus:histogram(
        "nginx_http_request_duration_seconds", "HTTP request latency", {"host"})
      metric_connections = prometheus:gauge(
        "nginx_http_connections", "Number of HTTP connections", {"state"})
    }
    log_by_lua_block {
      metric_requests:inc(1, {ngx.var.server_name, ngx.var.status})
      metric_latency:observe(tonumber(ngx.var.request_time), {ngx.var.server_name})
    }
Last step is to configure a separate server that will expose the metrics. Please make sure to only make it reachable from your Prometheus server: sudo vi /etc/nginx/sites-enabled/default
server {
  listen 9145;
  #allow 192.168.0.0/16;
  #deny all;
  location /metrics {
    content_by_lua_block {
      metric_connections:set(ngx.var.connections_reading, {"reading"})
      metric_connections:set(ngx.var.connections_waiting, {"waiting"})
      metric_connections:set(ngx.var.connections_writing, {"writing"})
      prometheus:collect()
    }
  }
}
Metrics will be available at http://your.nginx:9145/metrics
kirti.nehra@opstree.com
Data source config
Collector type:
Collector plugins:
Collector config:
Revisions
Upload an updated version of an exported dashboard.json file from Grafana
| Revision | Description | Created | |
|---|---|---|---|
| Download |