proxmox
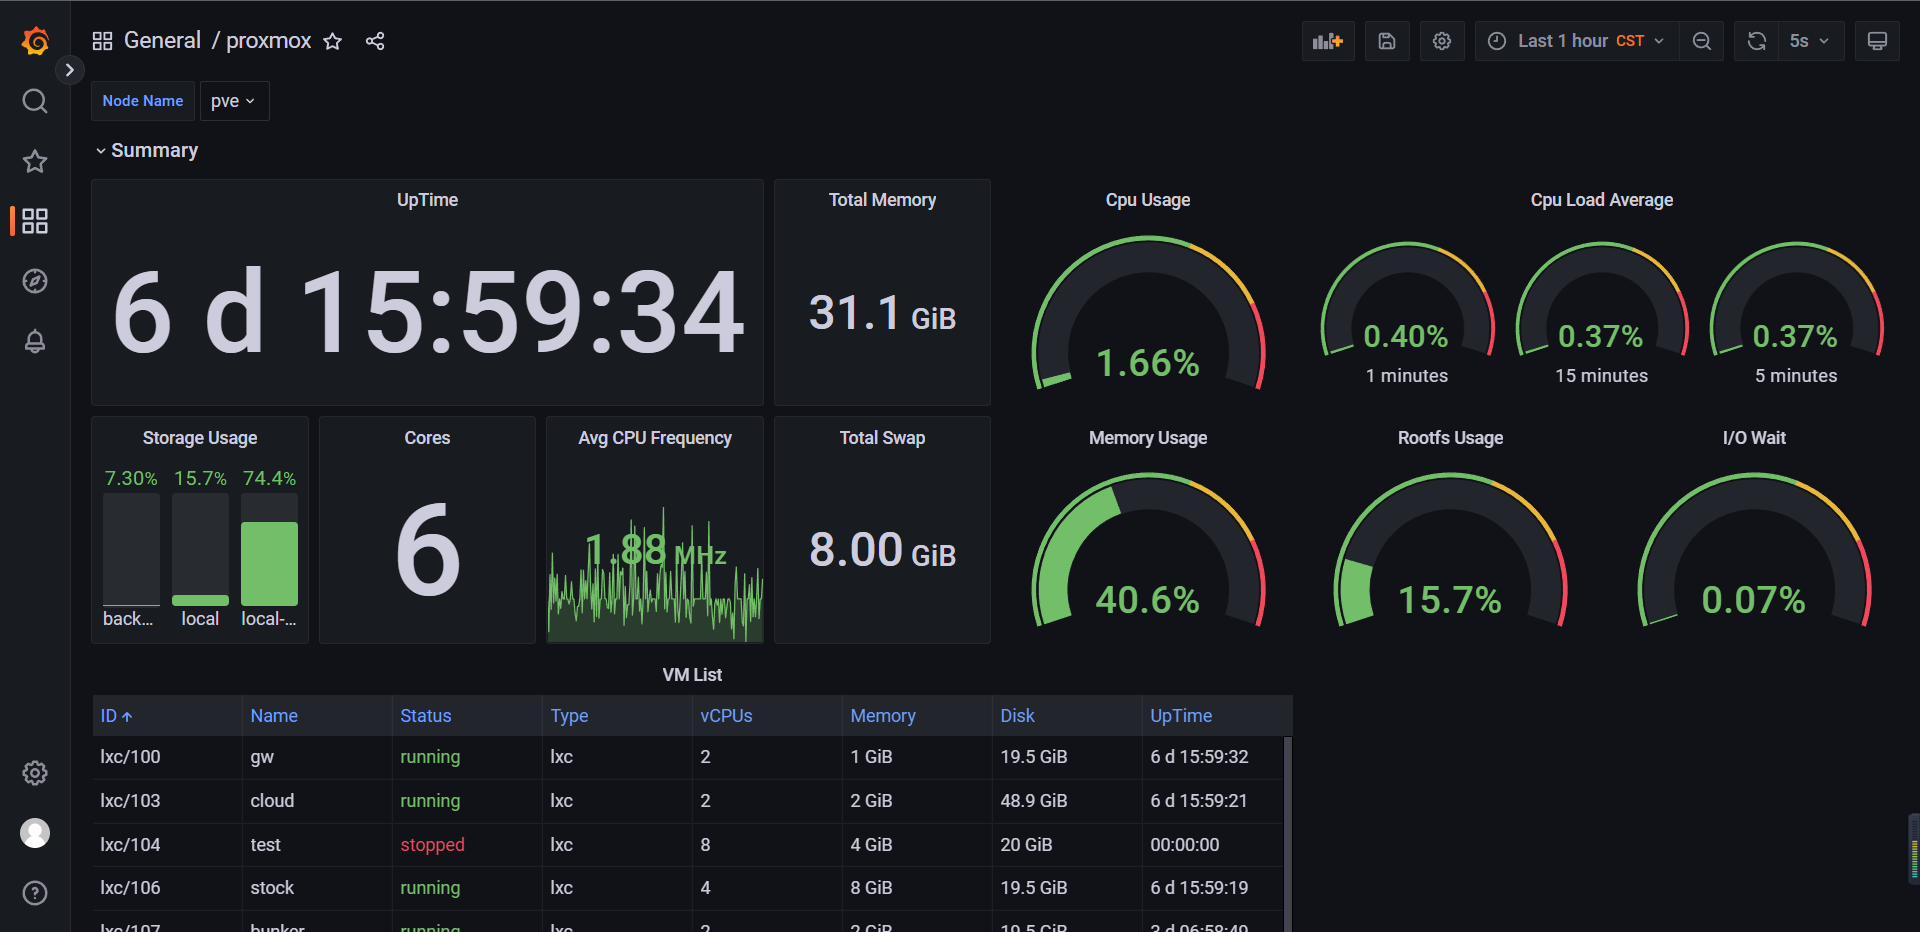
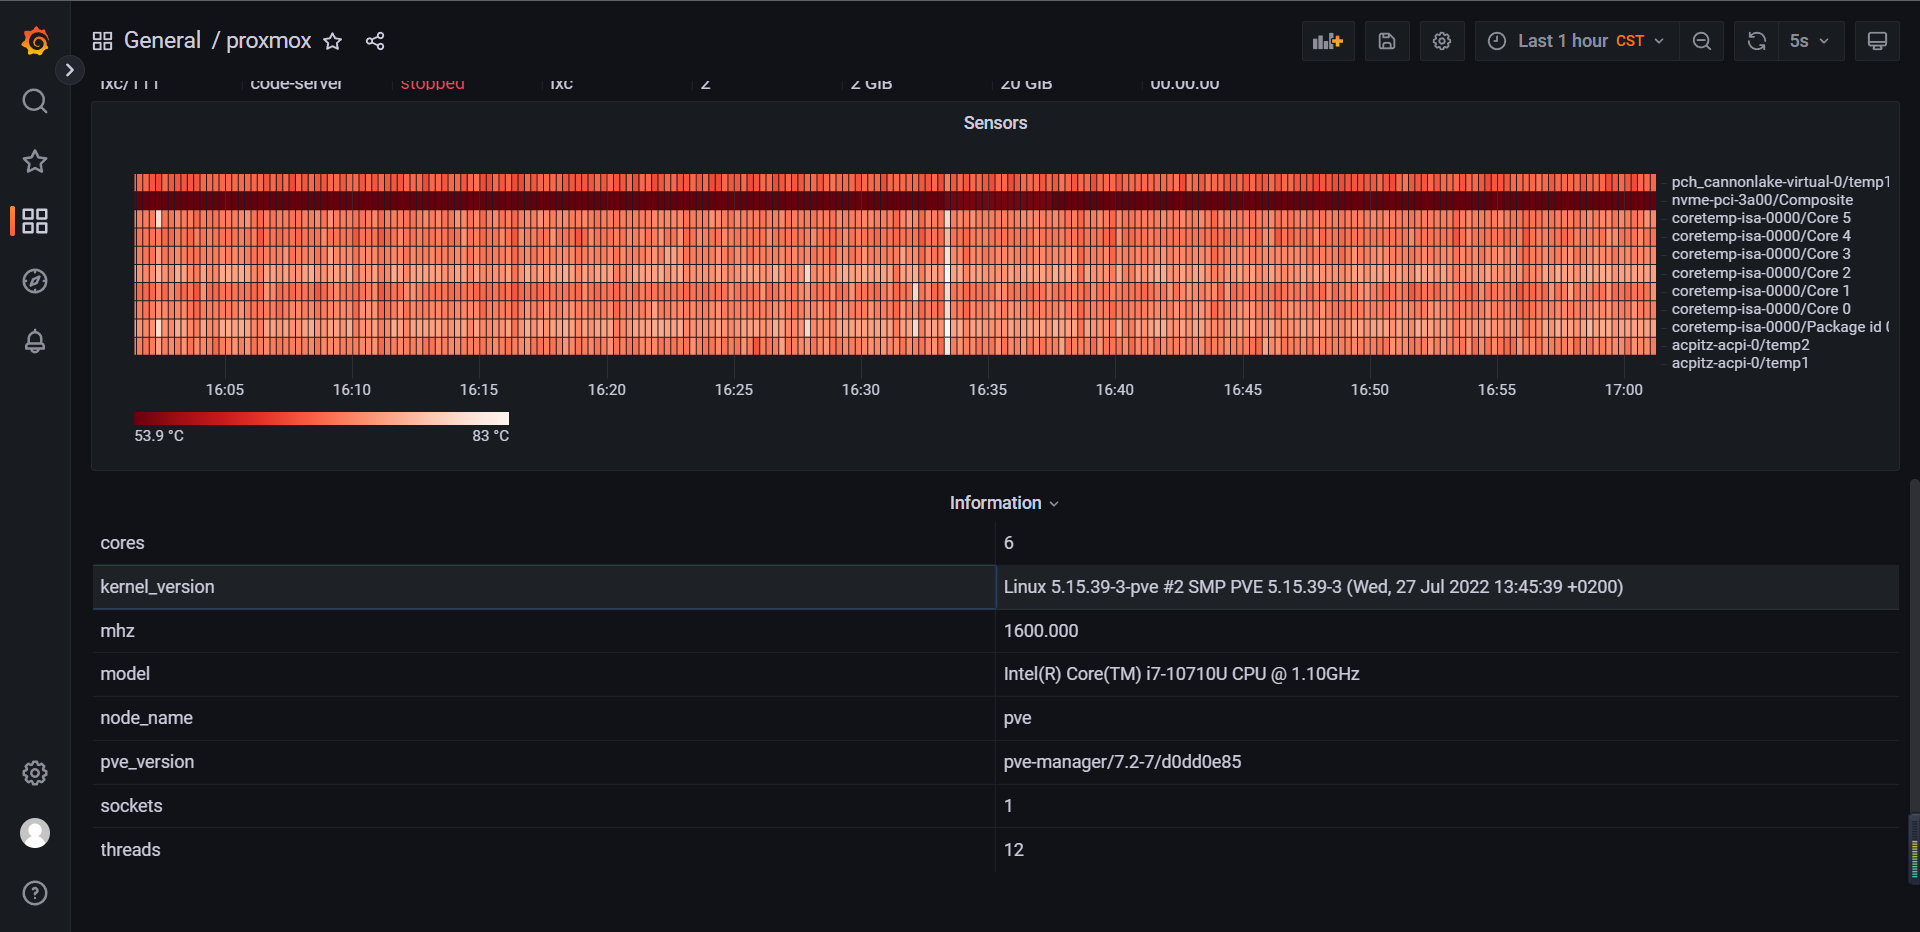
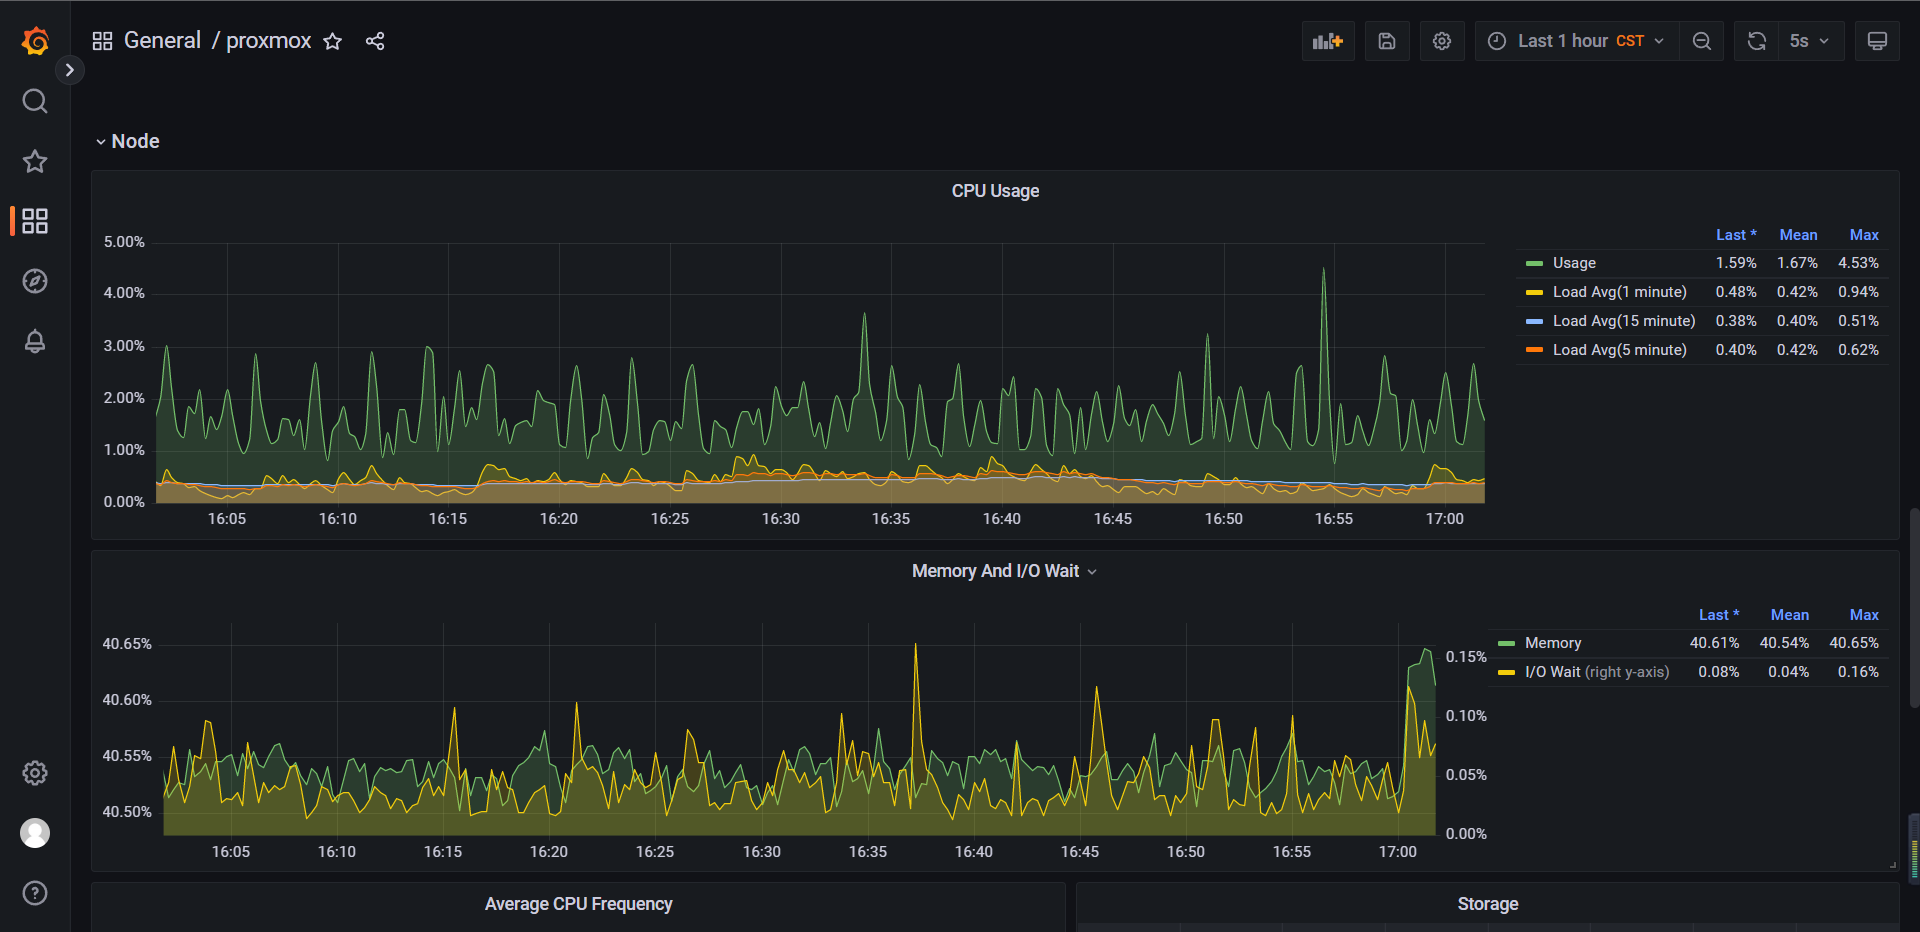
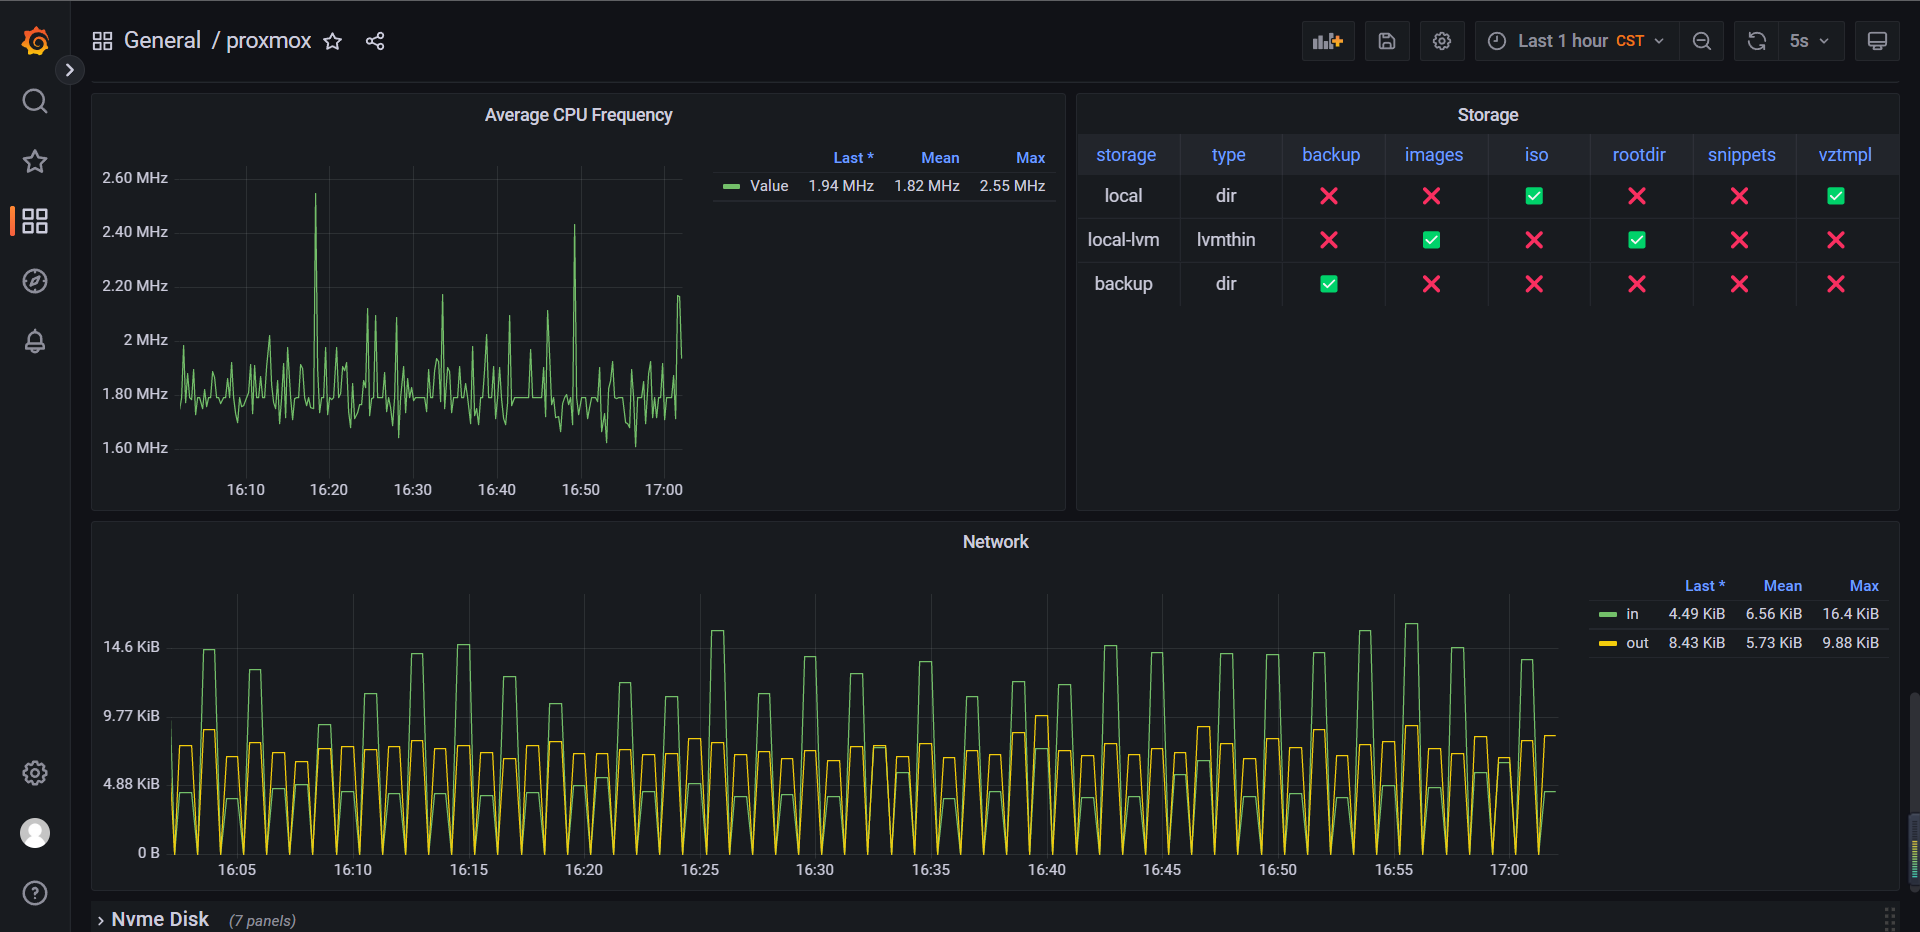
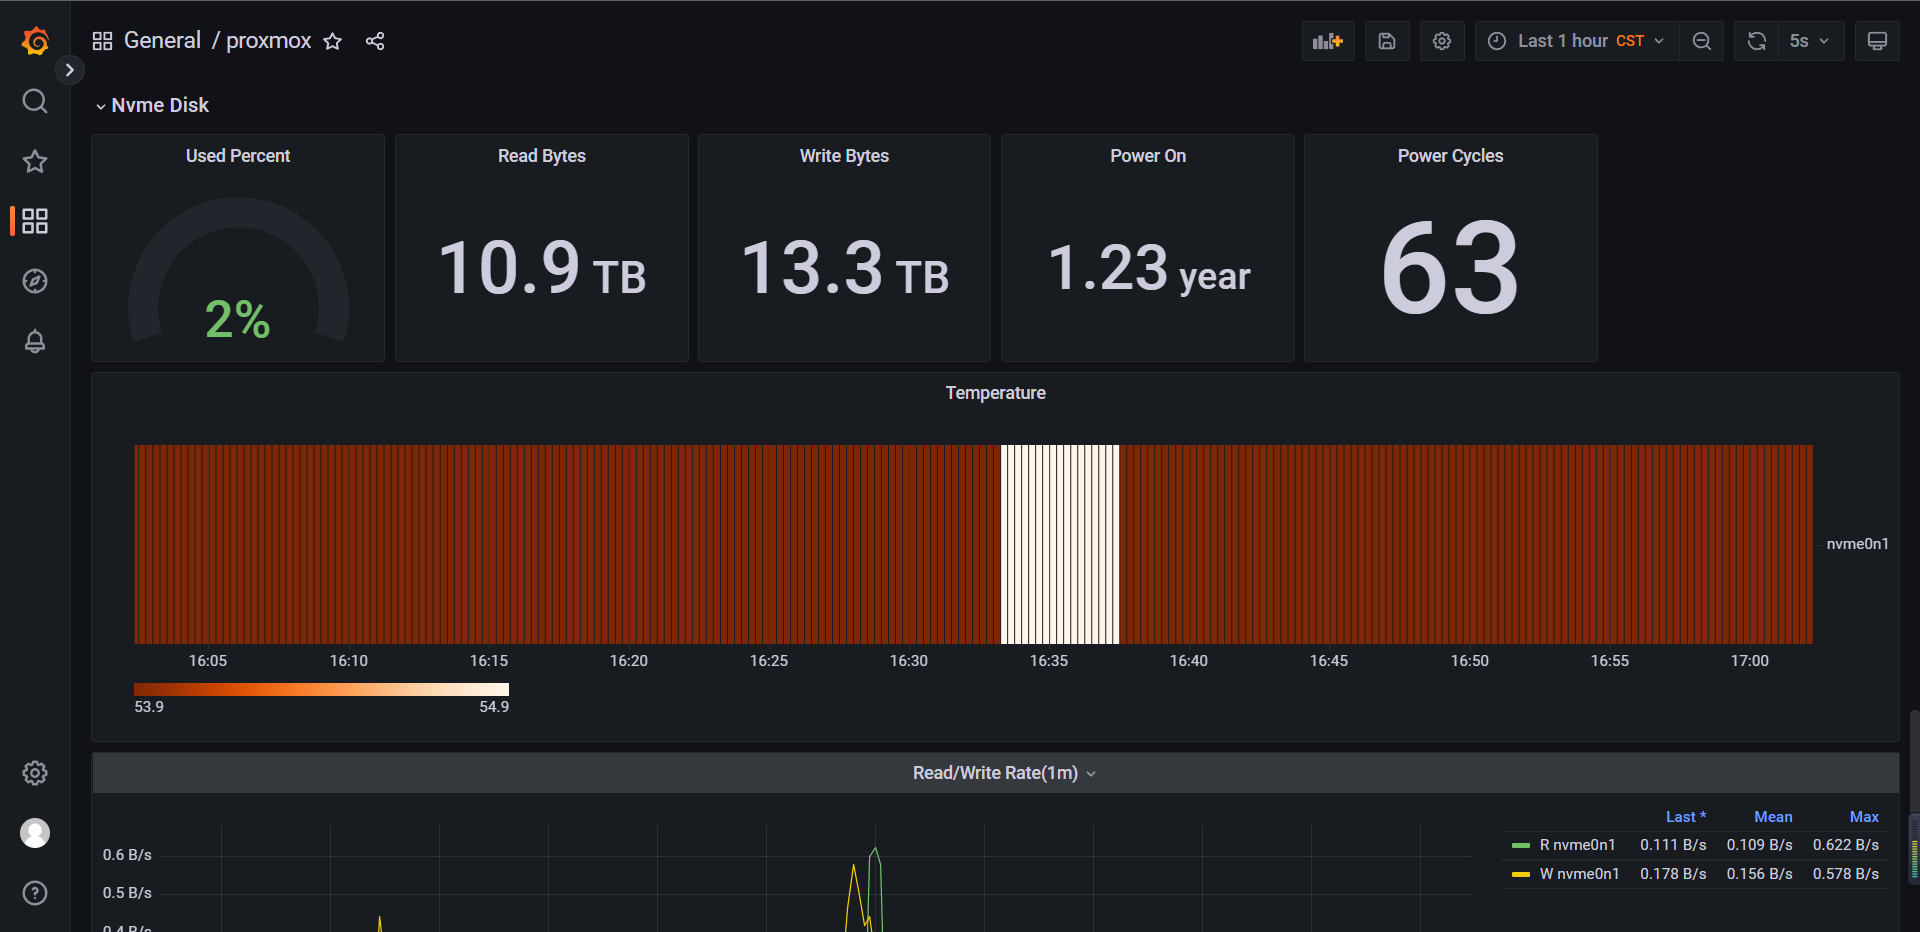
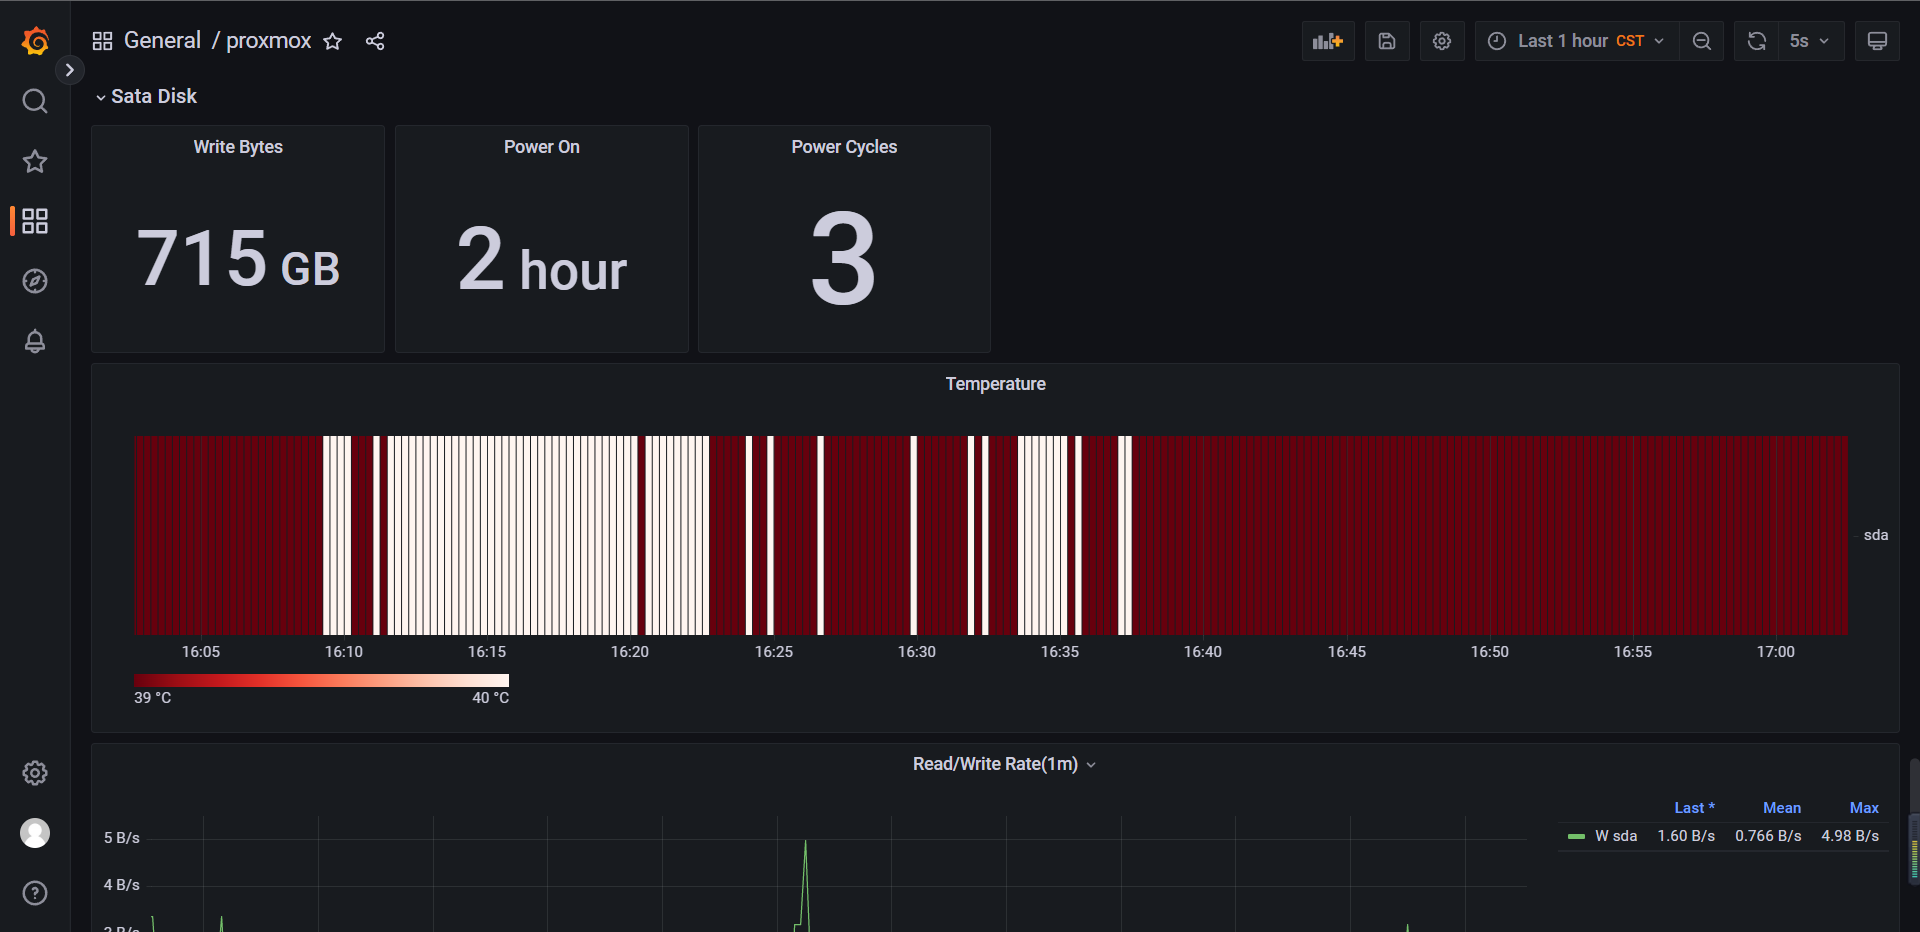
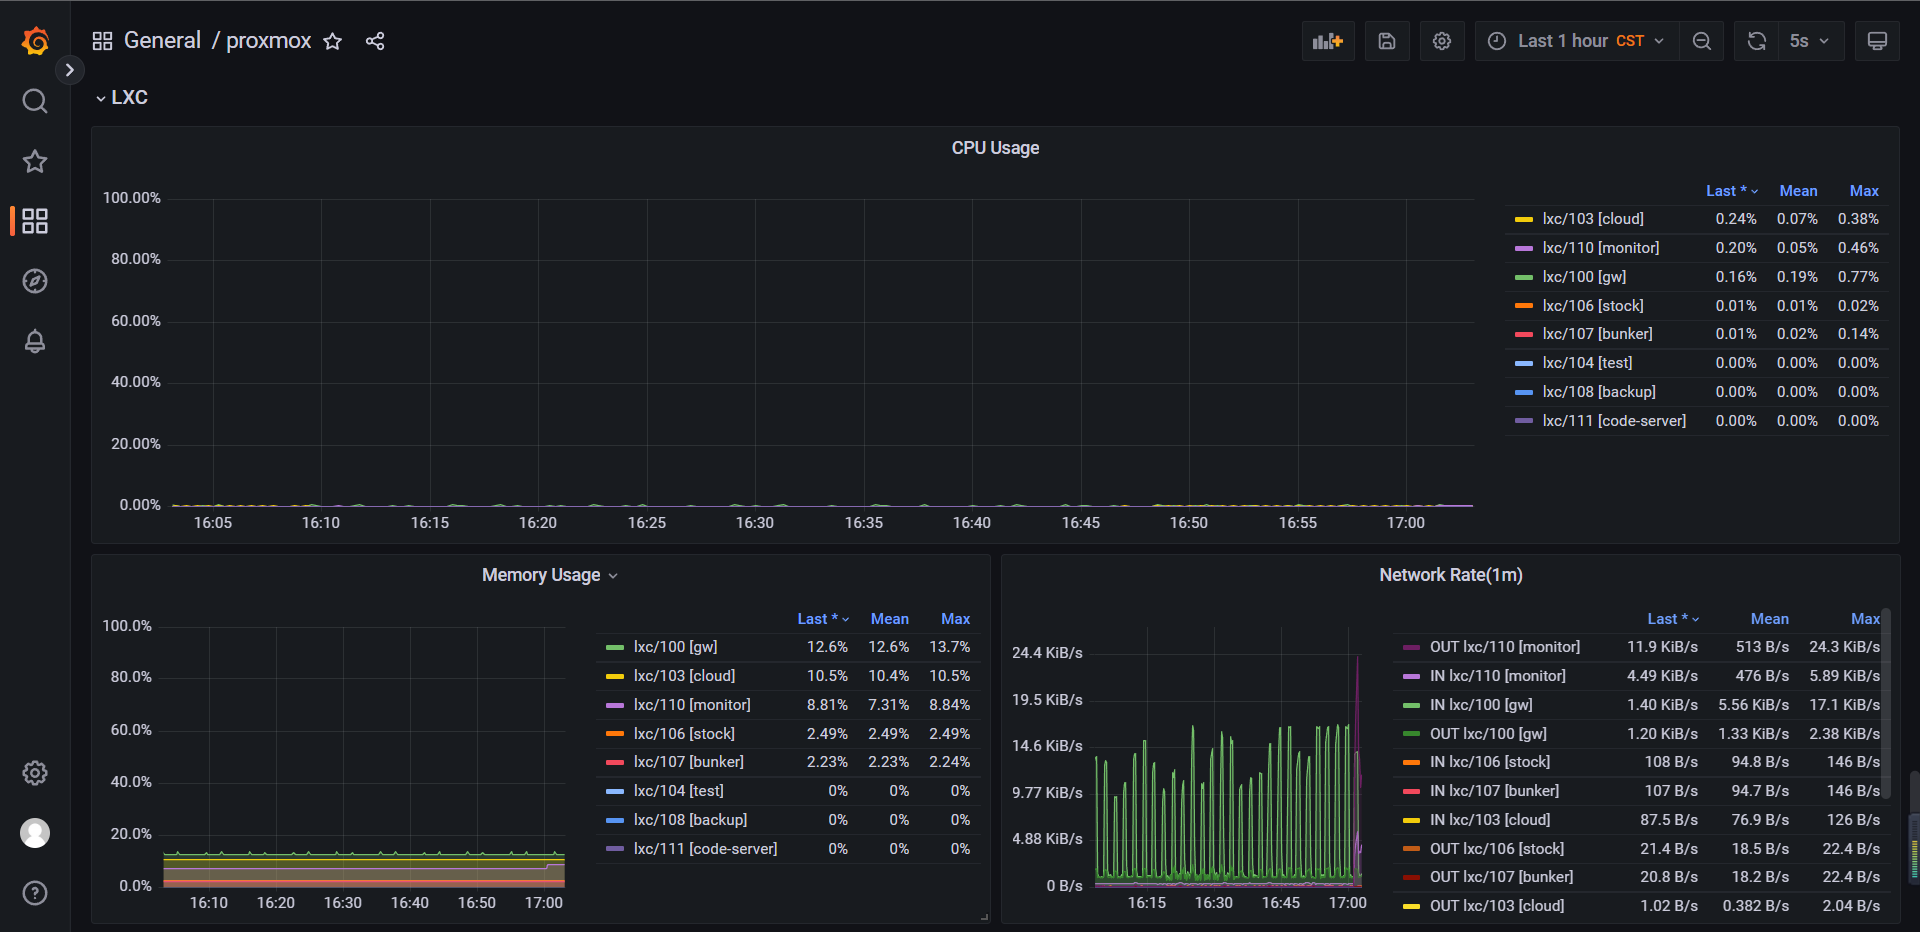
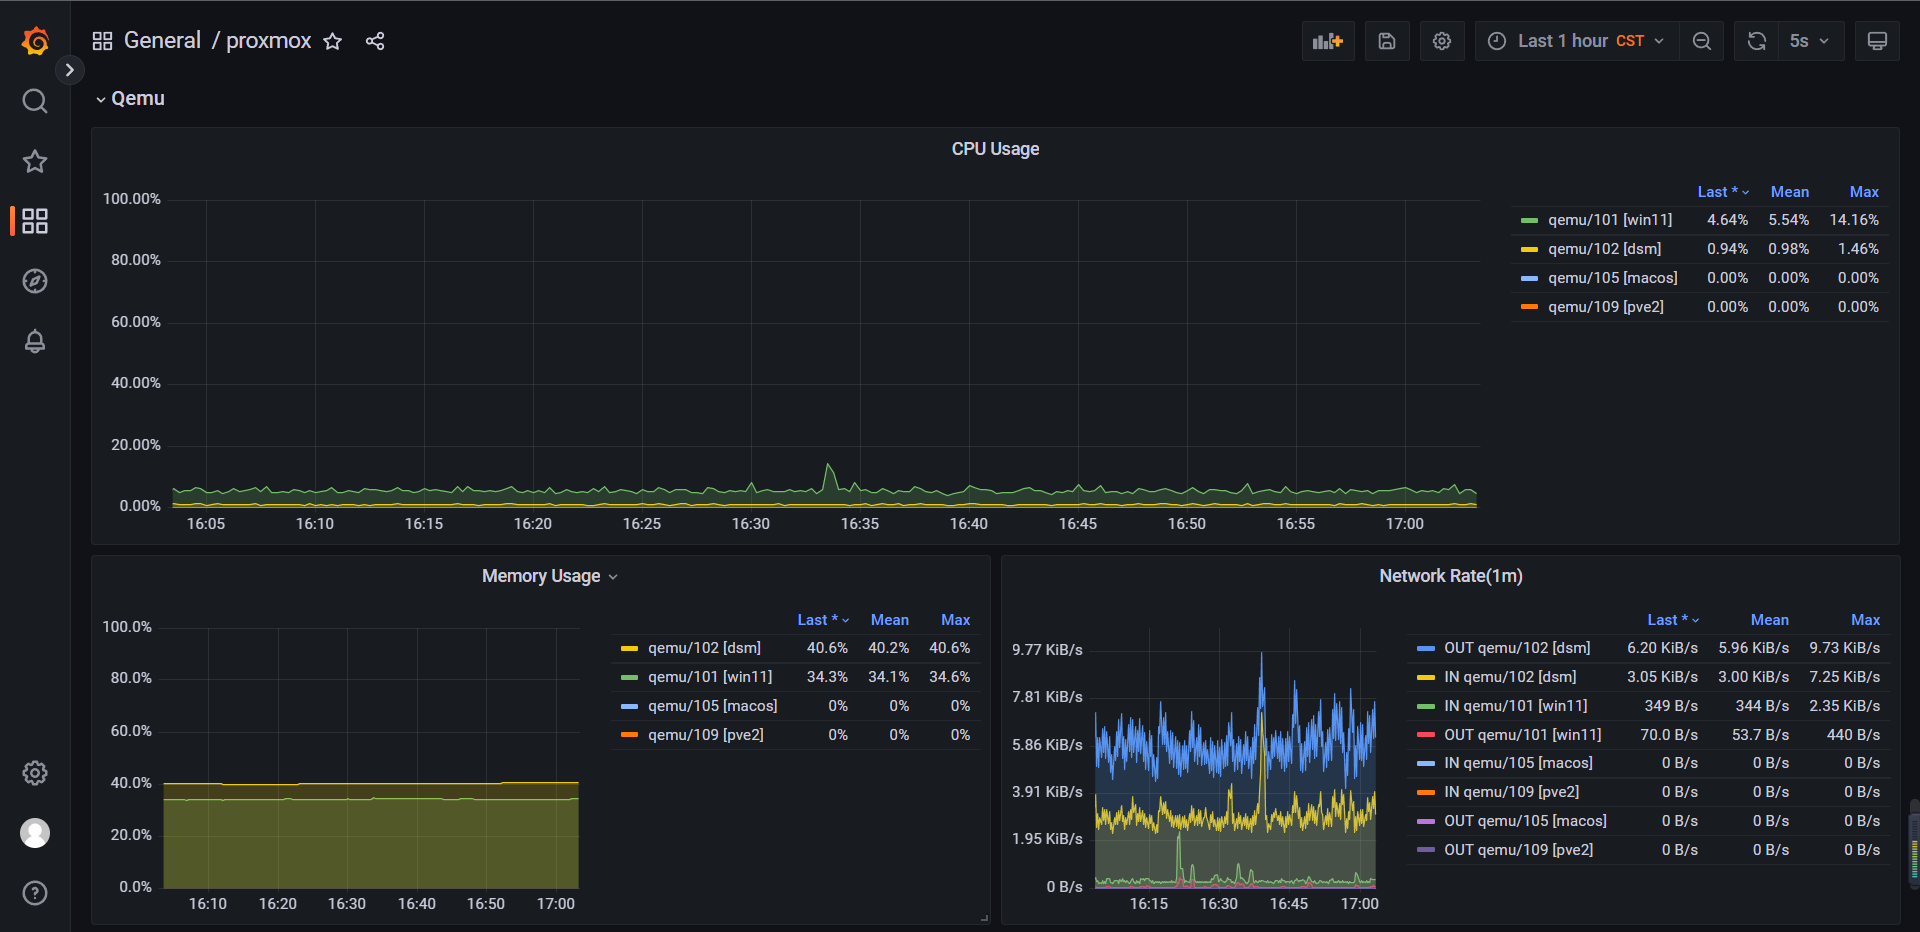
This dashboard shows the proxmox nodes information(cpu cores, cpu frequency, disk list, sensors temperature, ...), nvme/sata disk information(read/write bytes, power on hours, power cycles, ...), vm information(vm list, vm cpu/memory/disk usage, ...) and so on.
The dashboard is fed by a Prometheus data source, please use exporter to collect metrics.
Data source config
Collector type:
Collector plugins:
Collector config:
Revisions
Upload an updated version of an exported dashboard.json file from Grafana
| Revision | Description | Created | |
|---|---|---|---|
| Download |