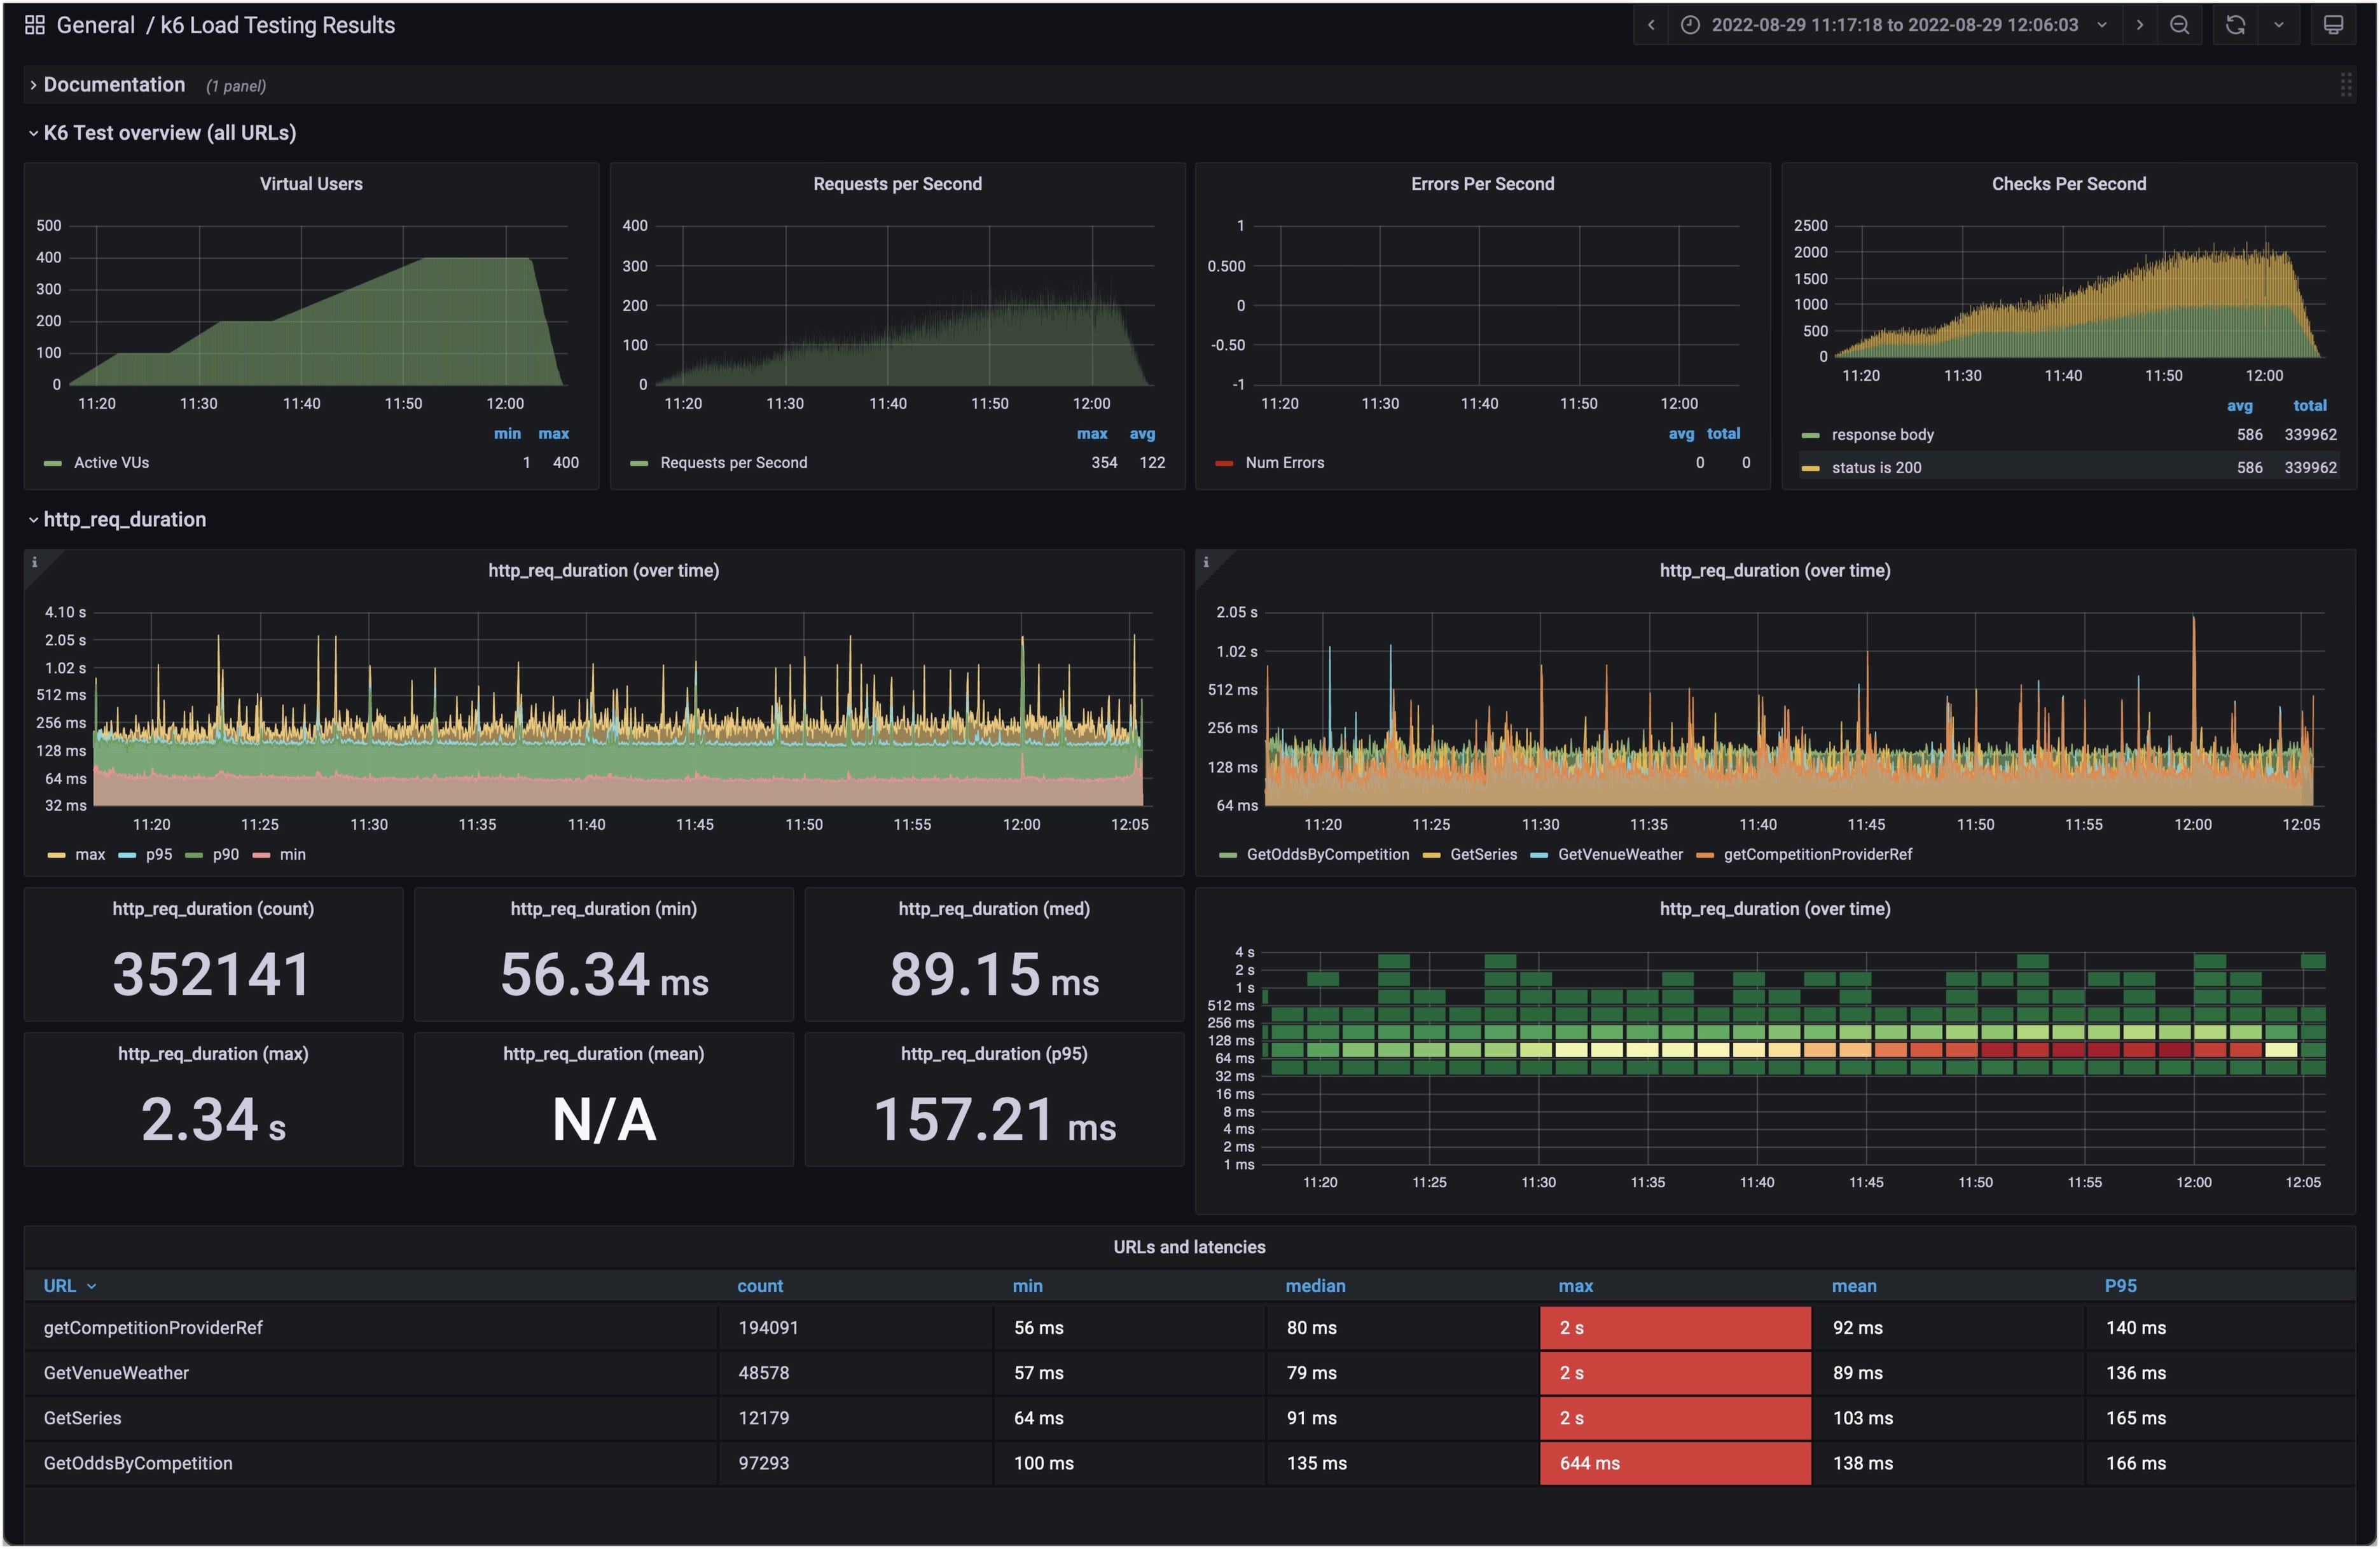
k6 Load Testing Results (dina)
A dashboard for visualizing results from the k6.io load testing tool, using the InfluxDB exporter.Based on https://grafana.com/dashboards/4411
Sample docker compose
version: '3.4'
networks:
k6:
grafana:
services:
influxdb:
image: influxdb:1.8
networks:
- k6
- grafana
ports:
- "8086:8086"
environment:
- INFLUXDB_DB=k6
grafana:
image: grafana/grafana:8.4.10
networks:
- grafana
ports:
- "3000:3000"
environment:
- GF_AUTH_ANONYMOUS_ORG_ROLE=Admin
- GF_AUTH_ANONYMOUS_ENABLED=true
- GF_AUTH_BASIC_ENABLED=false
volumes:
- ./grafana:/etc/grafana/provisioning/
Data source config
Collector config:
Upload an updated version of an exported dashboard.json file from Grafana
| Revision | Description | Created | |
|---|---|---|---|
| Download |
