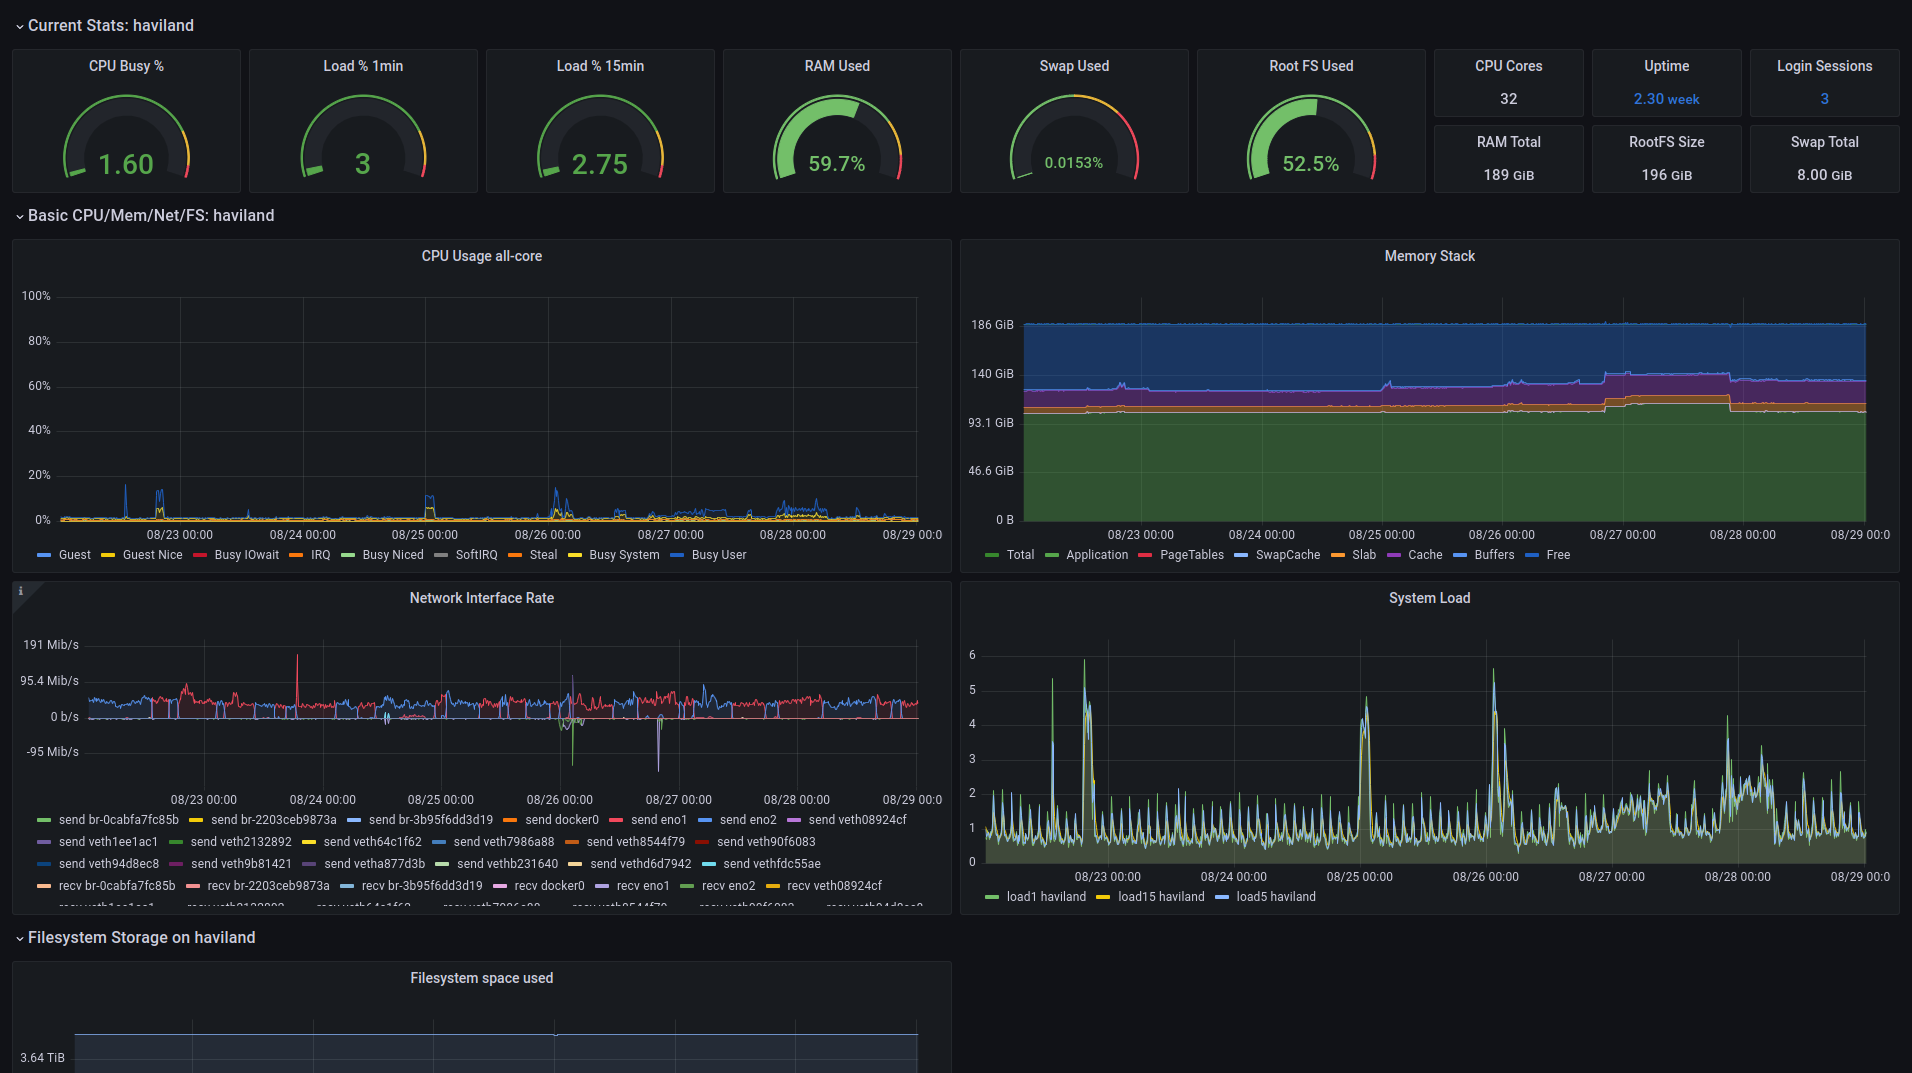
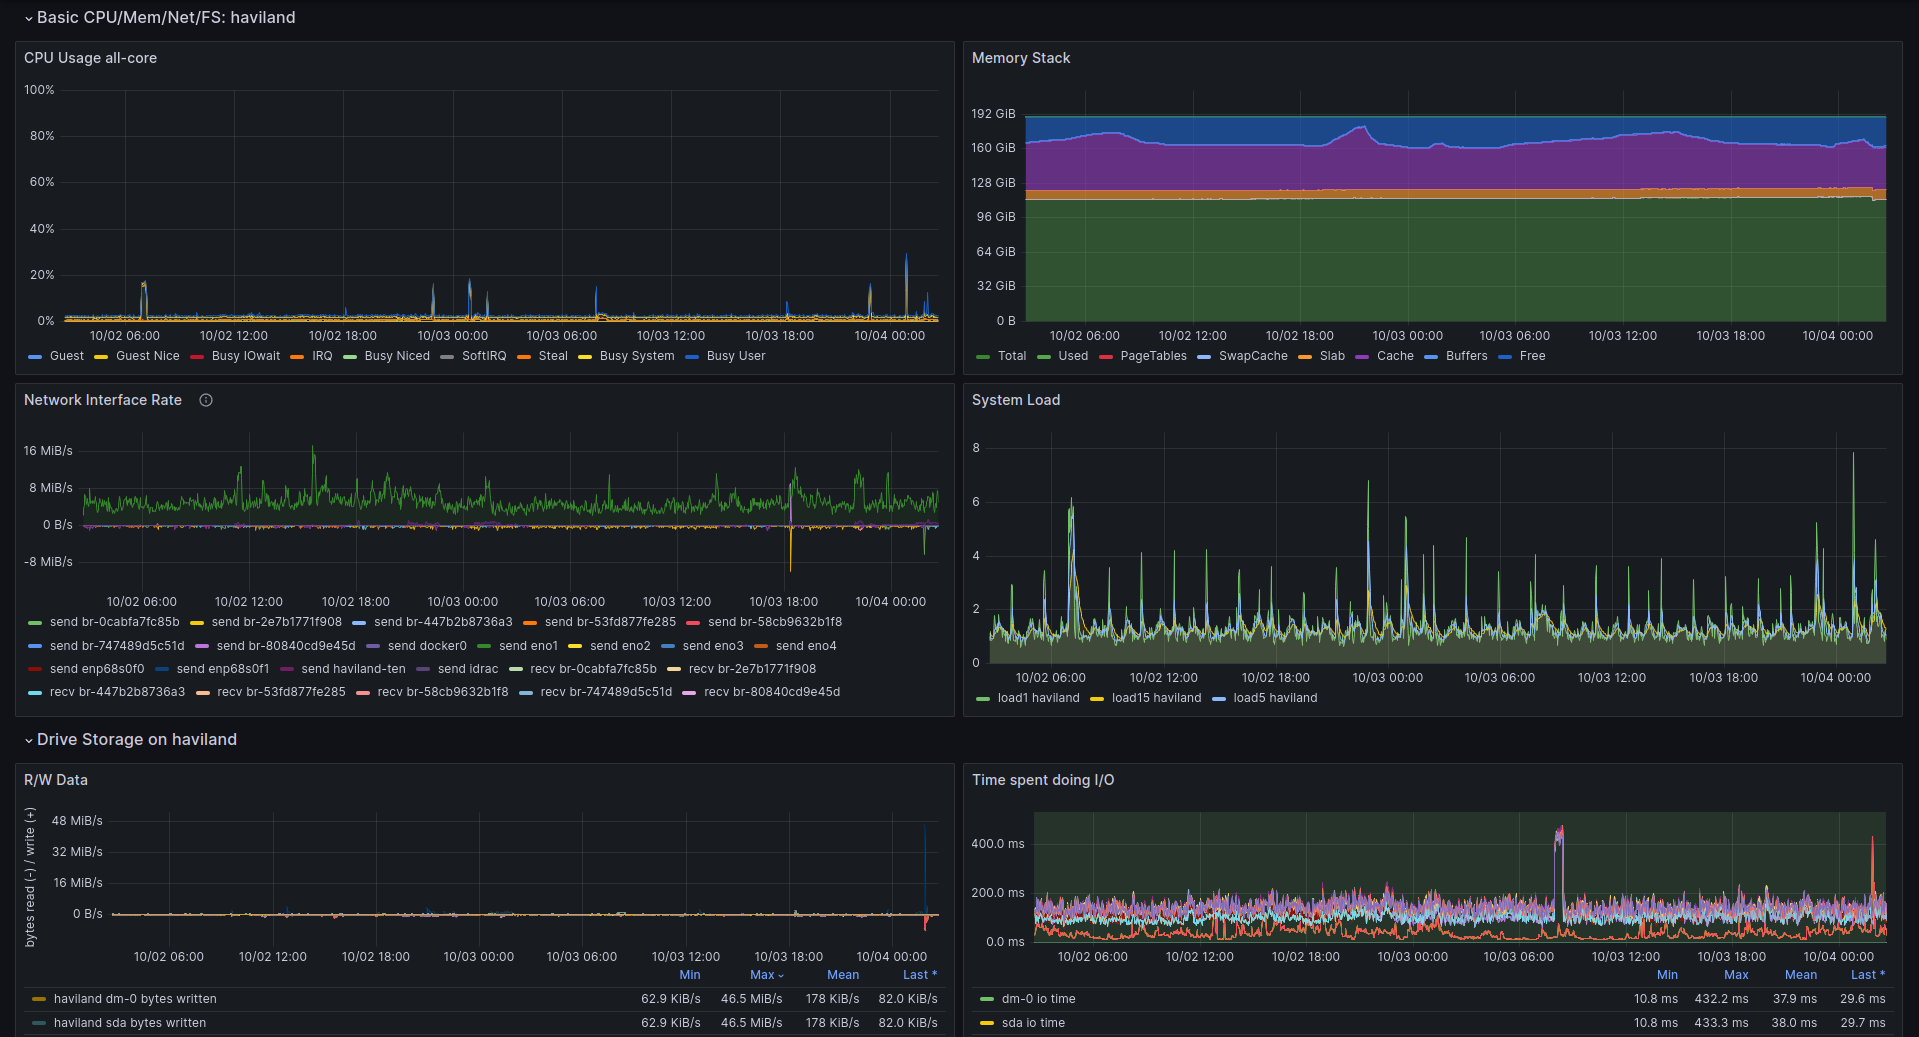
Influx General System Stats
This is still a work in progress, eventually the plan is to have all the collected-by-default metrics visible. These queries are most likely not very efficient right now.
The aim is to replicate the utility and functionality of "Node Exporter Full": https://grafana.com/grafana/dashboards/1860-node-exporter-full/
Unlike https://grafana.com/grafana/dashboards/928-telegraf-system-dashboard/ this dashboard uses Flux query language, it won't work using the SQL-like data source setting.
Another dashboard using Flux / InfluxDB 2: https://grafana.com/grafana/dashboards/15650-telegraf-influxdb-2-0-flux/
Data source config
Collector type:
Collector plugins:
Collector config:
Revisions
Upload an updated version of an exported dashboard.json file from Grafana
| Revision | Description | Created | |
|---|---|---|---|
| Download |