Teku - Detailed
Dashboard to monitor multiple Teku instances.
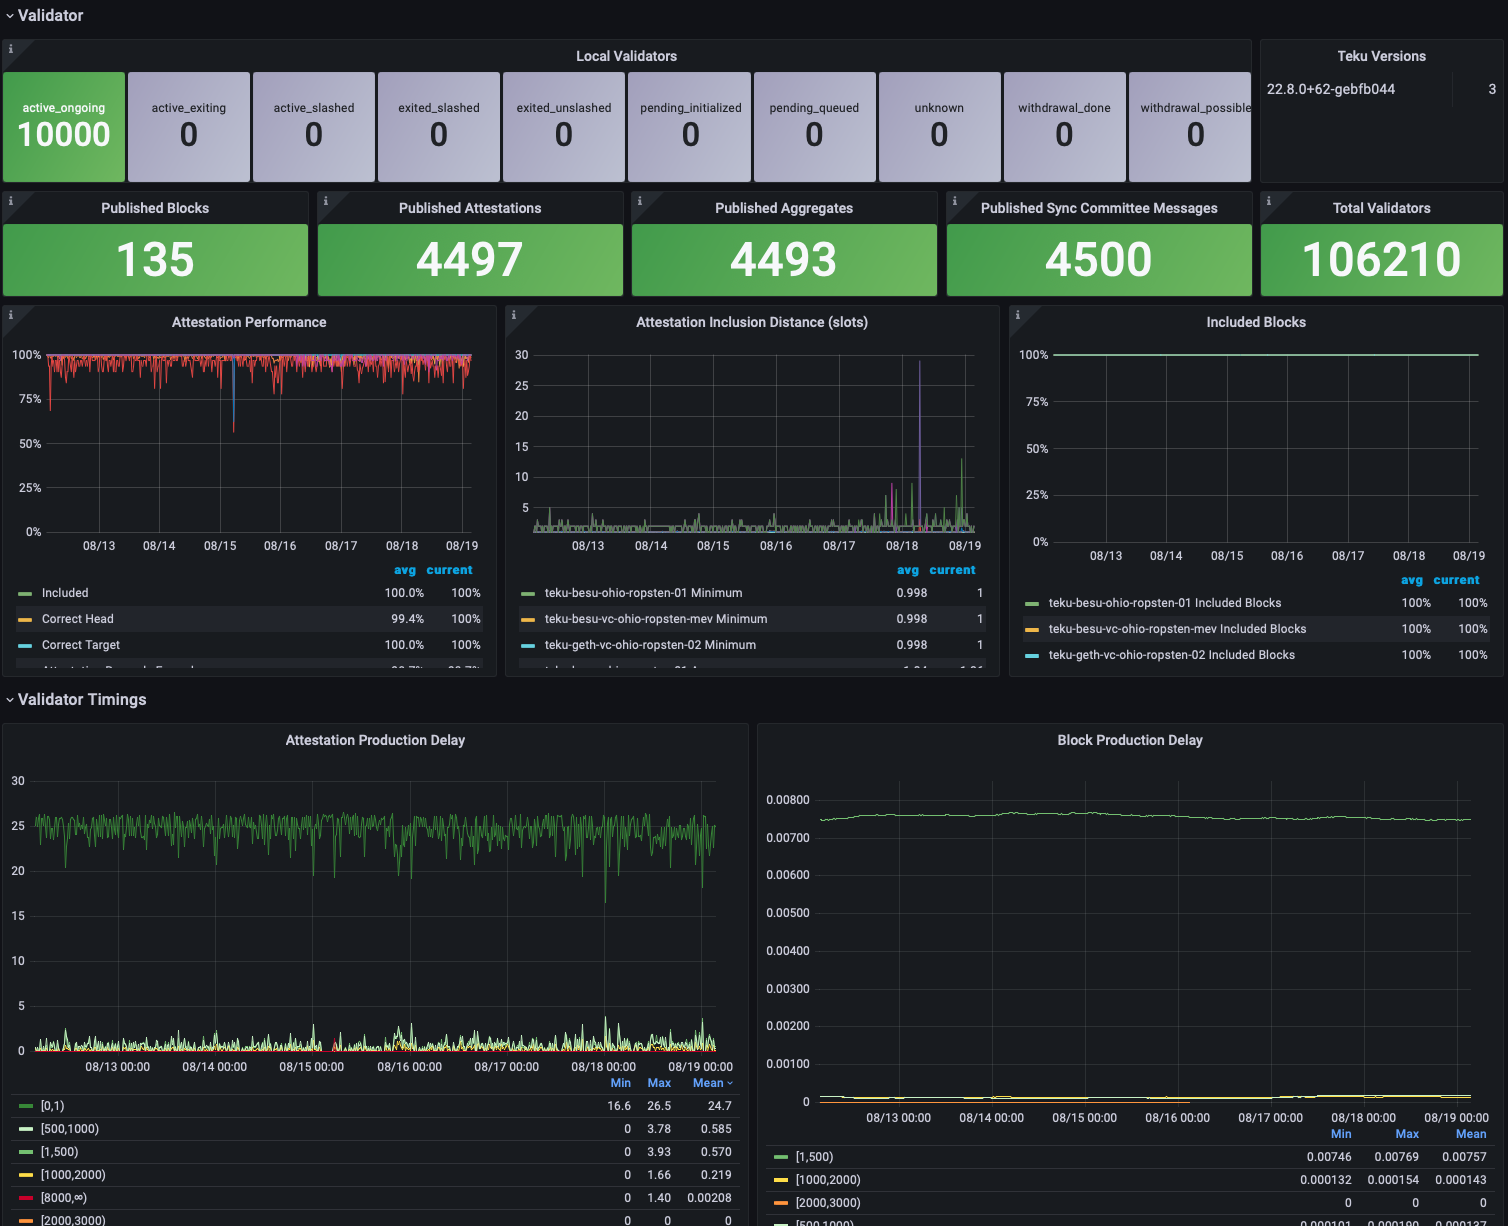
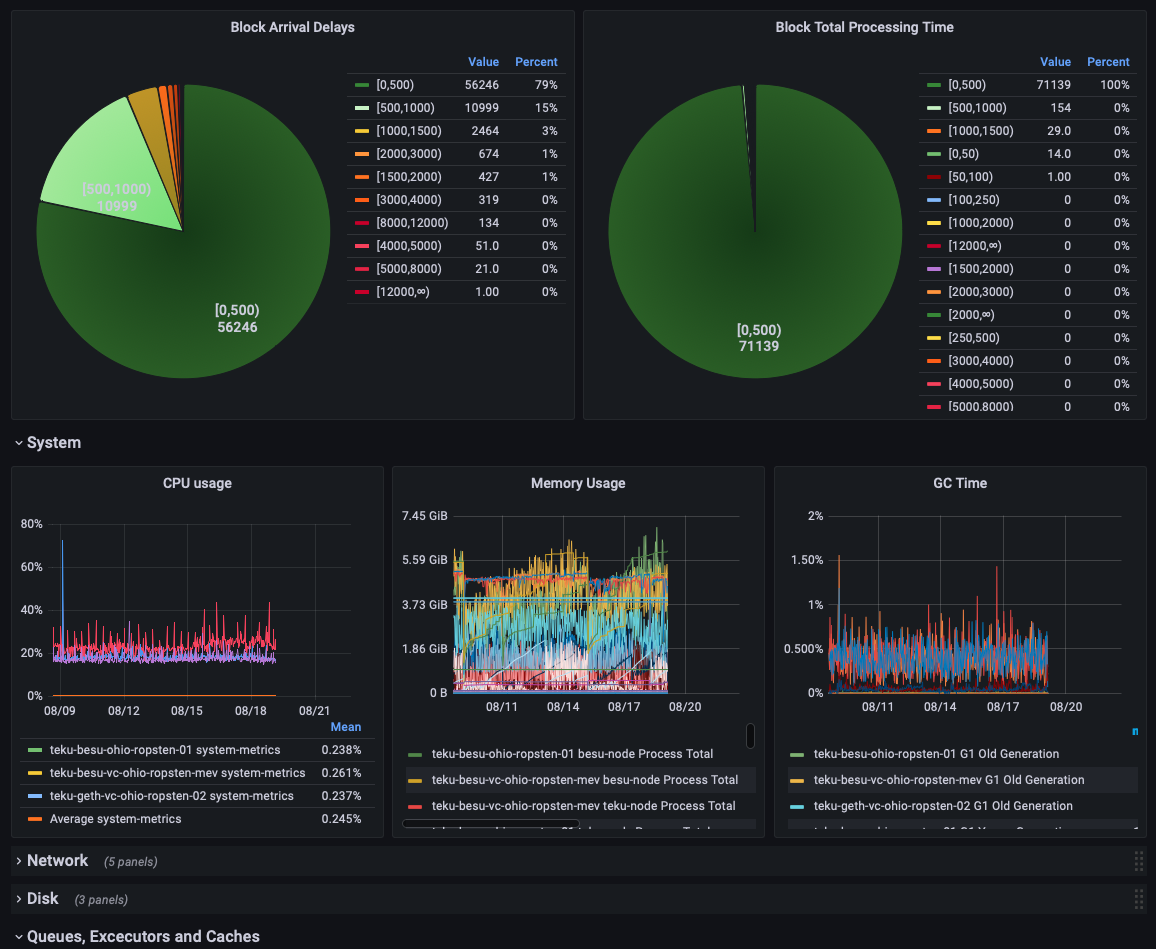
Provides a dashboard showing detailed information for one or more Teku nodes. The required data is exported directly from Teku to a Prometheus data store. The dashboard includes support for filtering the Teku nodes to show based on network (if the network label is applied to data) and between development and production nodes (if the alerting label is applied to data).
Many elements on this dashboard may be fairly meaningless to someone not familiar with the details of Teku and the metrics used may change between different Teku releases. It is intended that this dashboard be used as a source of examples for useful data that can be extracted from Teku metrics and visualised rather than used as-is.
Data source config
Collector config:
Upload an updated version of an exported dashboard.json file from Grafana
| Revision | Description | Created | |
|---|---|---|---|
| Download |