Kubernetes Cluster for RAM and CPU Utilization
Shows RAM and CPU utilization grouped by namespaces, deployments and specific pods. This dashboard shows the values at specific point in time, its useful for getting an instant feeling about what takes most of the resources in the cluster.
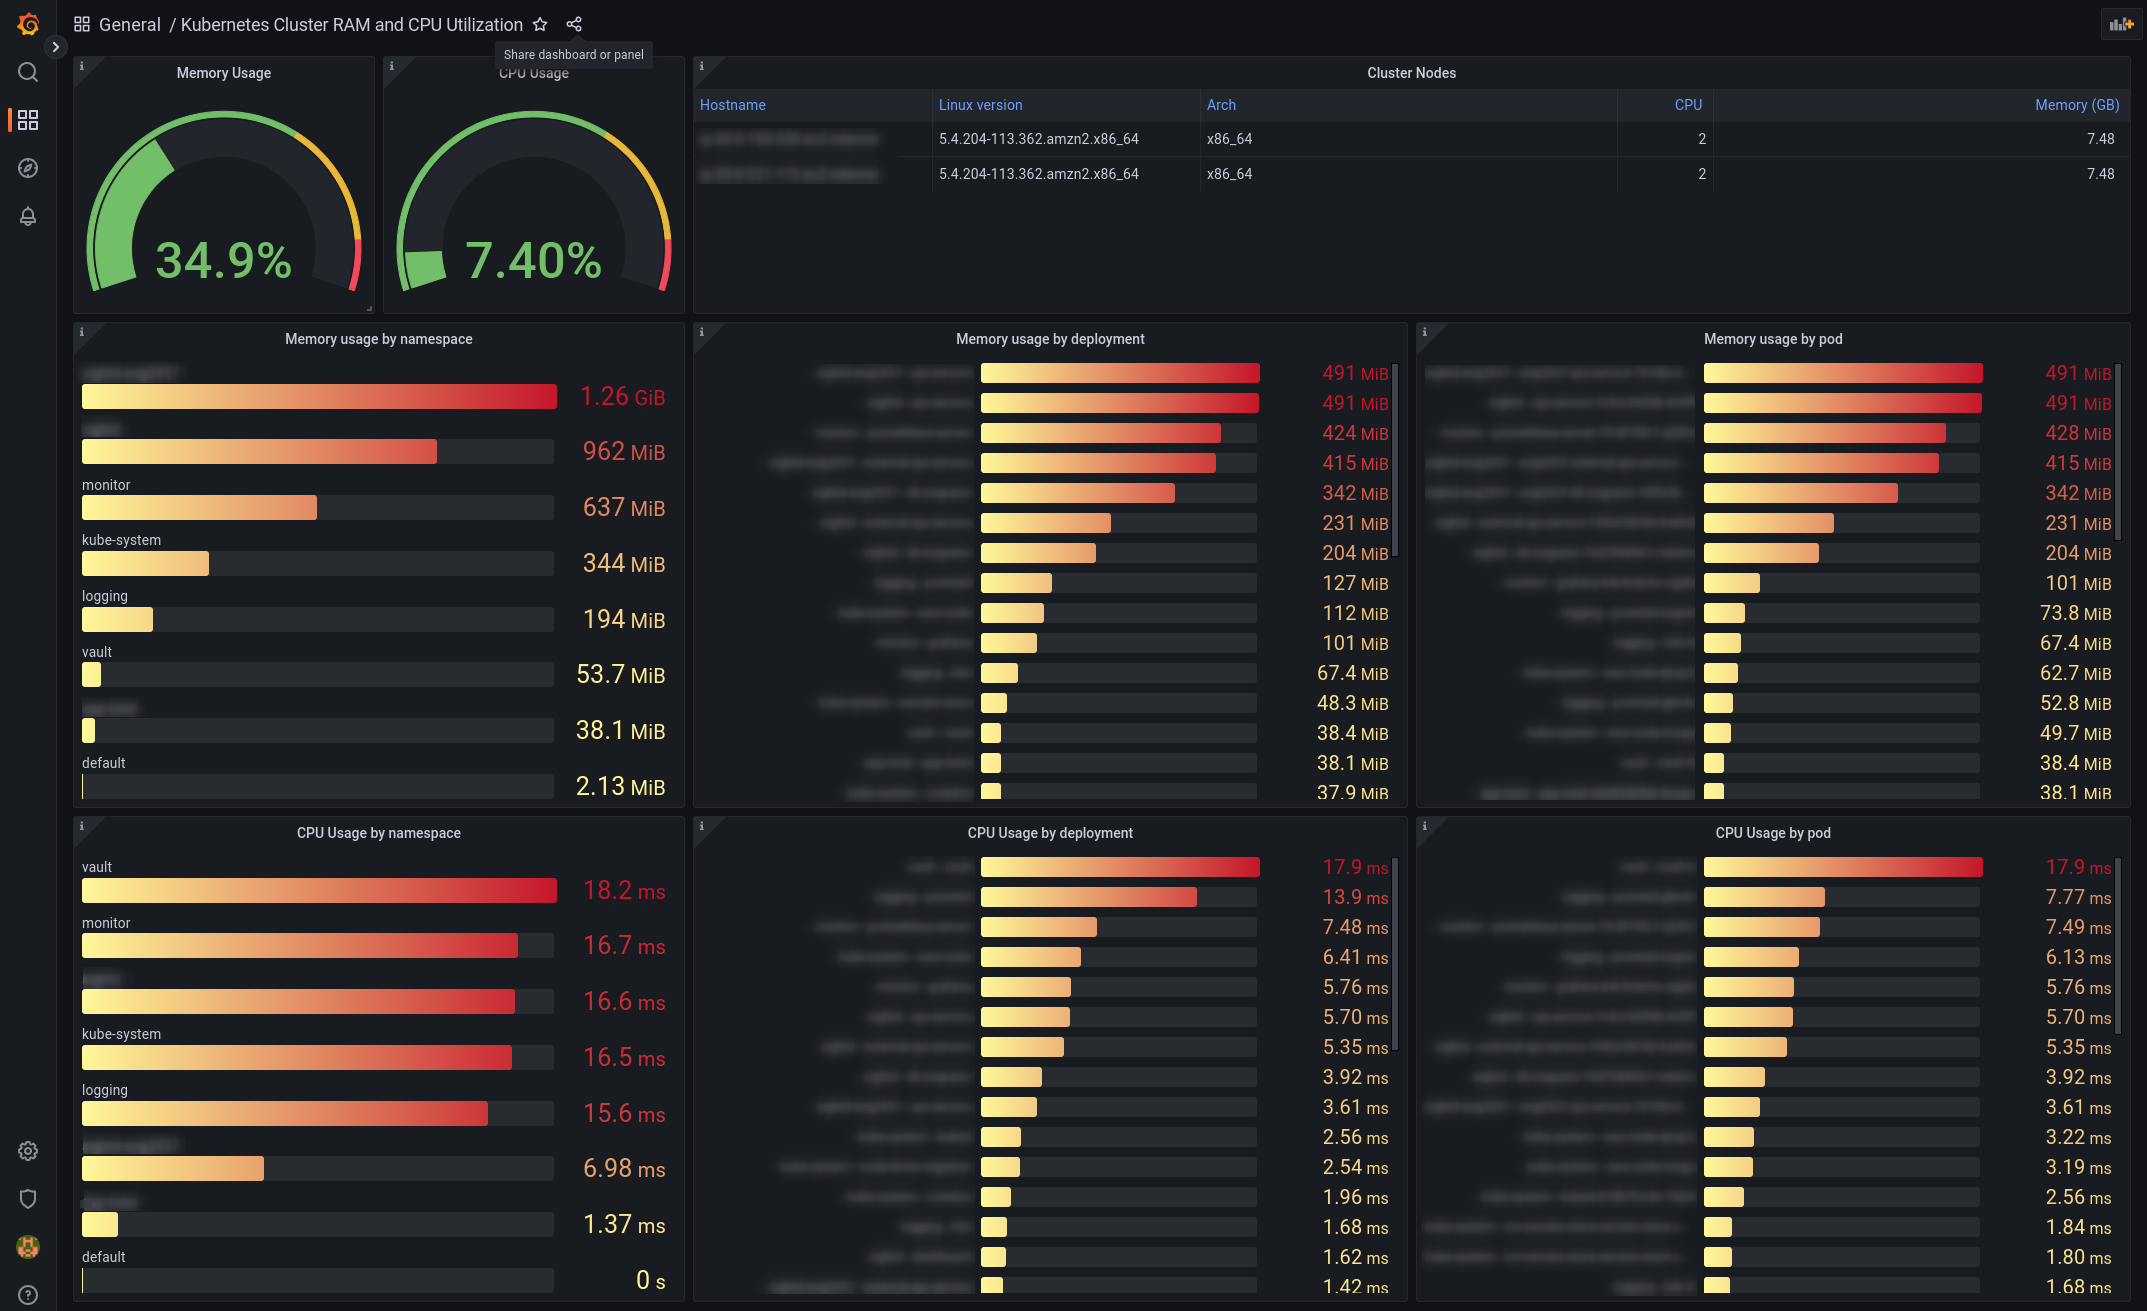
This dashboard shows the utilization, RAM and CPU, of a cluster at a specific point in time.
It helps to answer those questions quickly:
- Is my cluster running out of RAM or CPU?
- If so, what are the problematic namespaces, deployments and pods?
This dashboard uses the default metrics from the Prometheus Helm chart. It needs both Kubelet and Node Exporter metrics.
Data source config
Collector type:
Collector plugins:
Collector config:
Revisions
Upload an updated version of an exported dashboard.json file from Grafana
| Revision | Description | Created | |
|---|---|---|---|
| Download |
Kubernetes
Monitor your Kubernetes deployment with prebuilt visualizations that allow you to drill down from a high-level cluster overview to pod-specific details in minutes.
Learn more