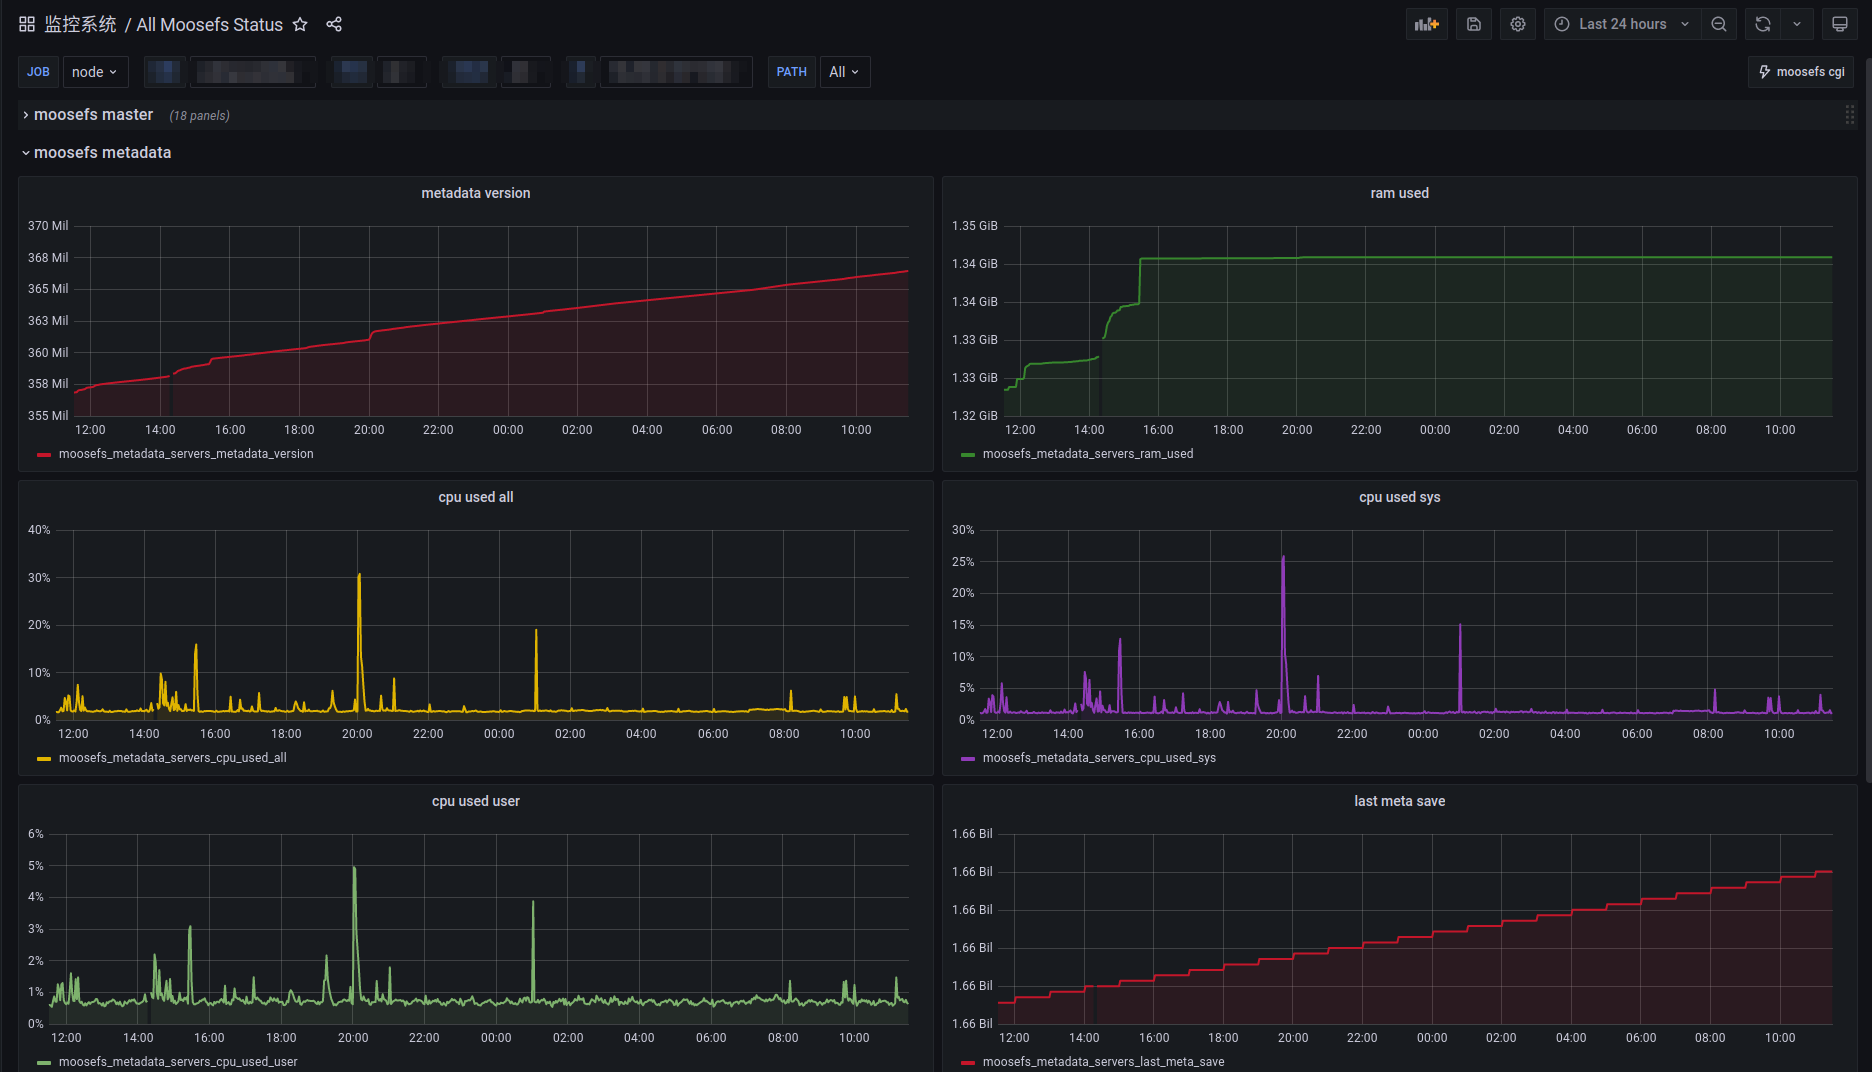
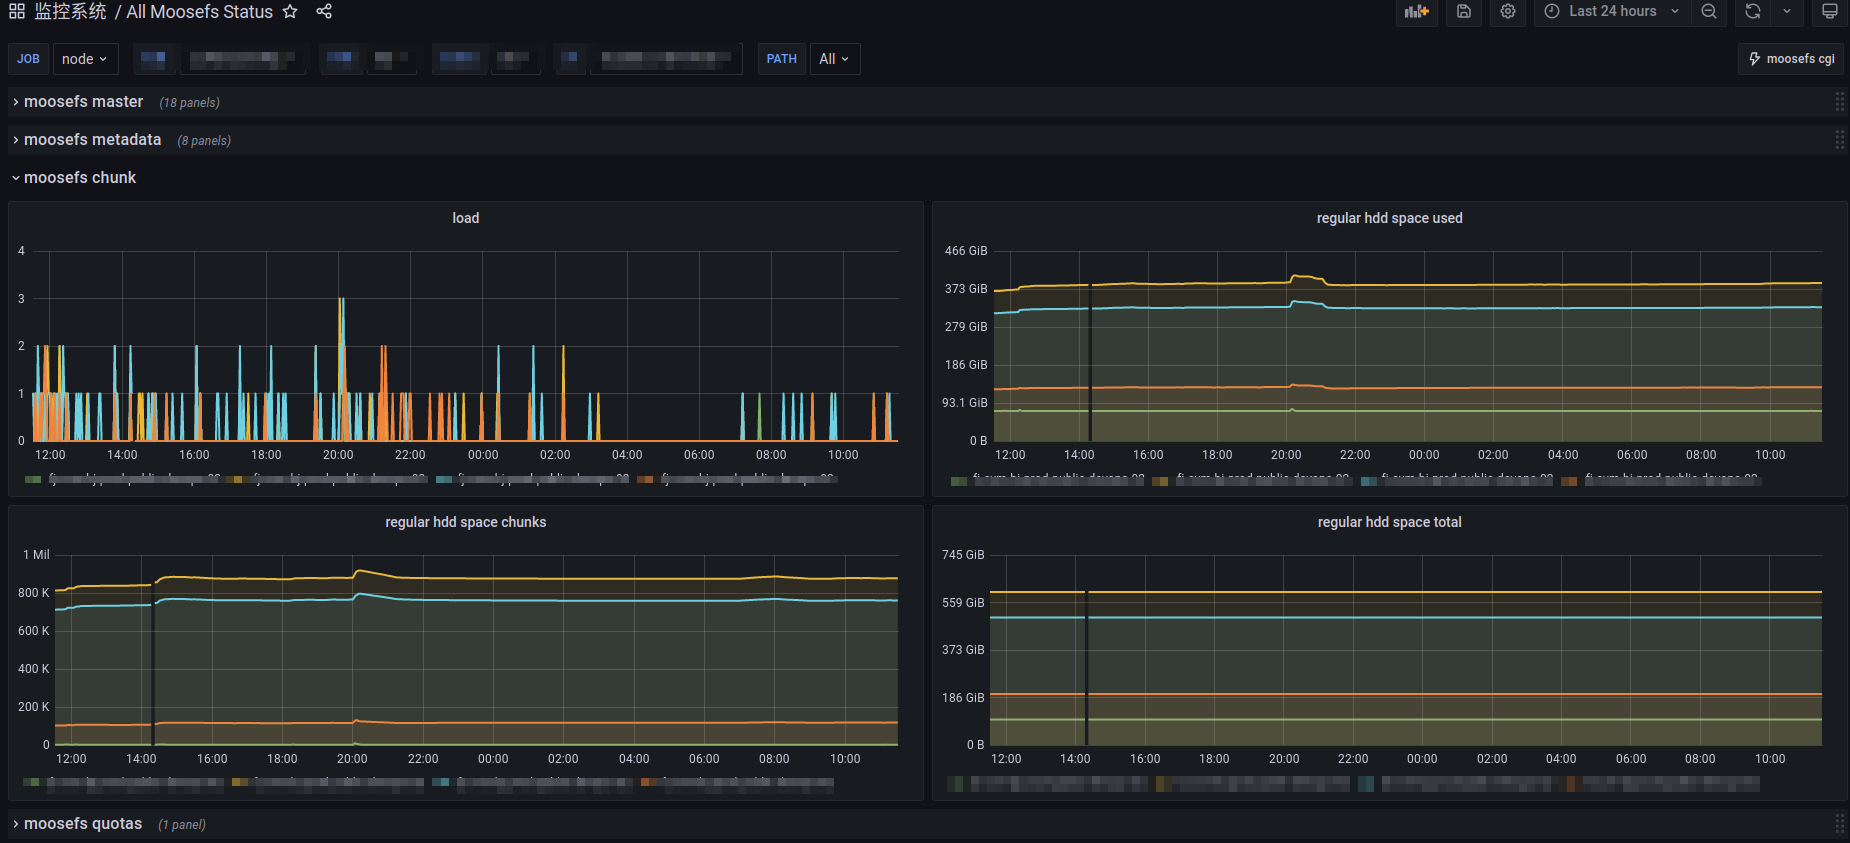
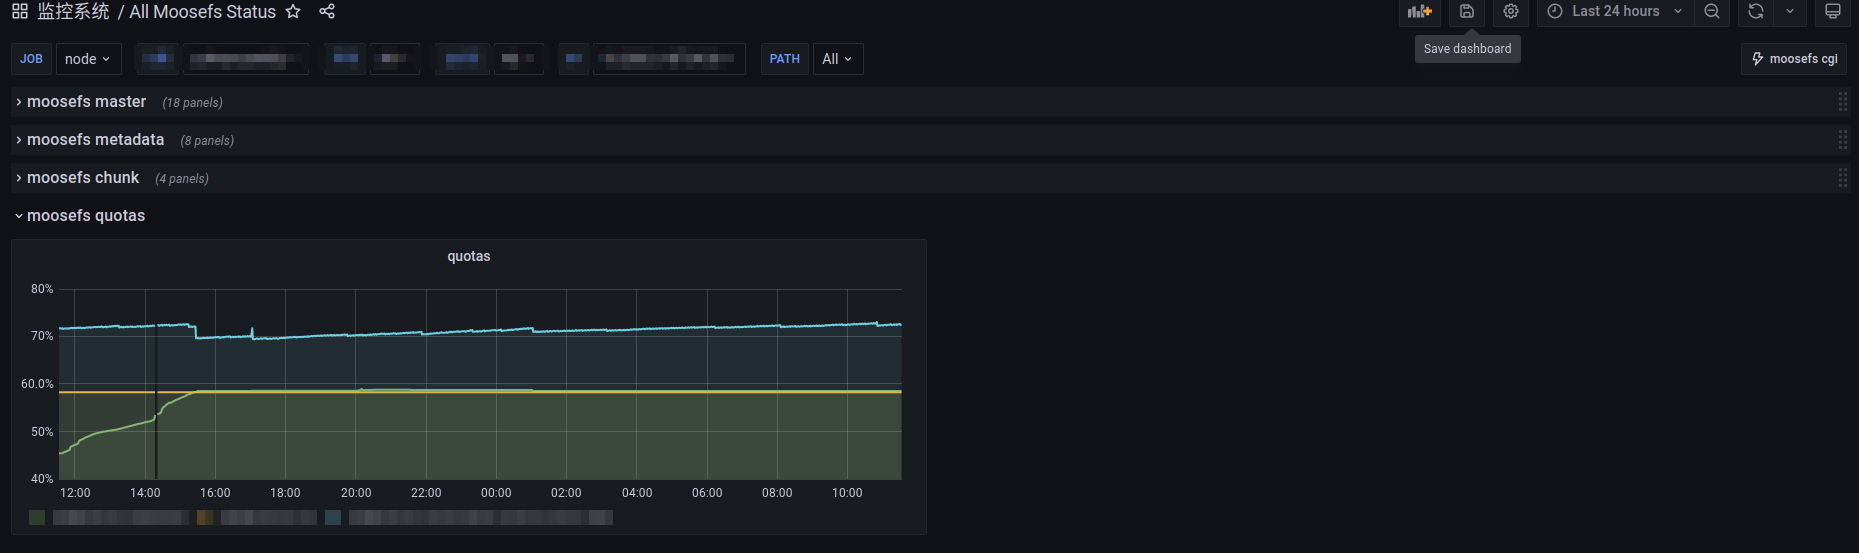
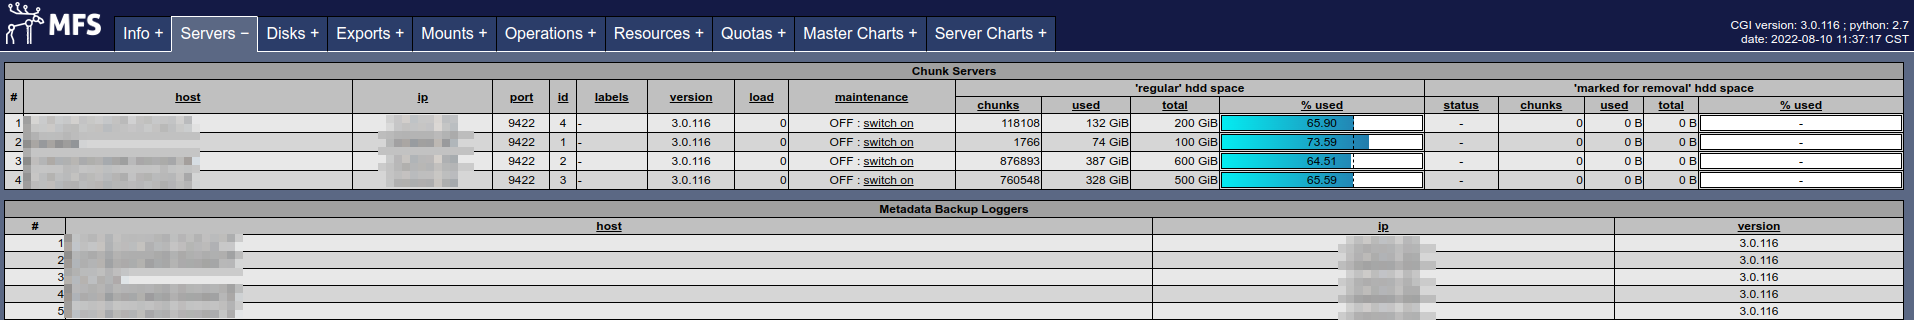
Moosefs Overview
Use the mfscli command to generate monitoring metrics that can be recognized by prometheus.

Vision requirement
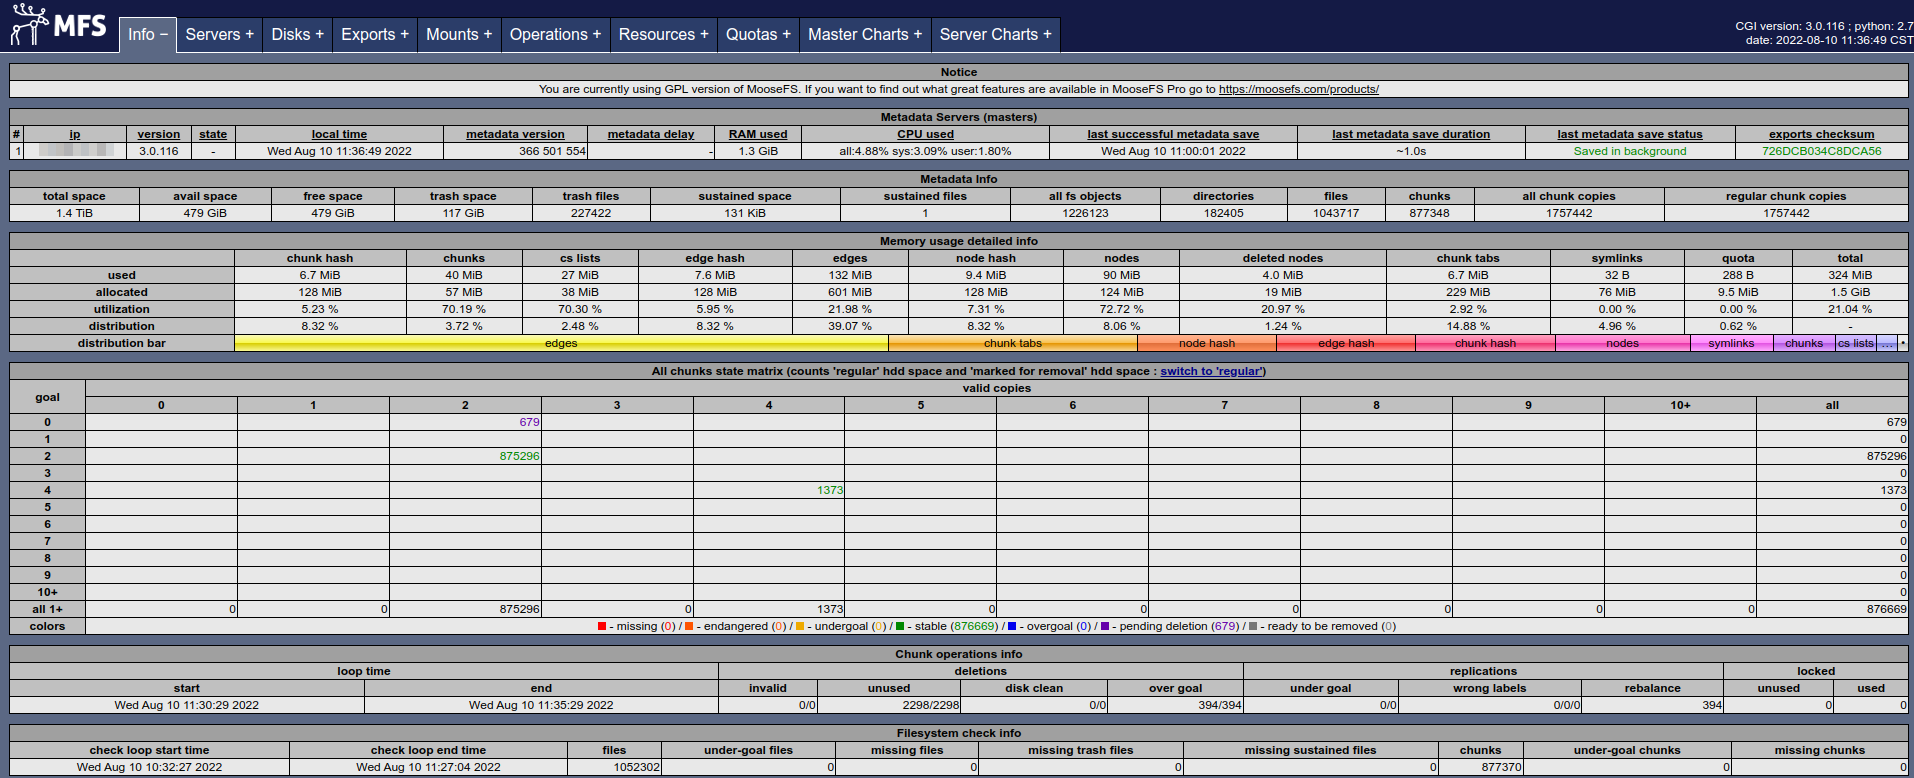
- moosefs:3.0116
How to use
1.Add the following to the node_exporter startup parameters
--collector.textfile.directory=/var/log/prometheus
reload node_exporter
2.Prepare the mfscli2prom script
3.Run mfscli2prom.awk on moosefs master node(monit is recommended)
check program "mfscli2prom" with path "/bin/sh -c '/usr/bin/mfscli -ns"|" -SIM -SMU -SIG -SCS -SIC -SSC -SQU | /opt/mfscli2prom.awk > /var/log/prometheus/mfscli.prom'" with timeout 10 seconds
        if status != 0 for 2 cycles then alert
$:monit reload
$:/etc/monit.d# monit summary mfscli2prom
Monit 5.30.0 uptime: 39d 20h 24m
┌─────────────────────────────────┬────────────────────────────┬───────────────┐
│ Service Name                    │ Status                     │ Type          │
├─────────────────────────────────┼────────────────────────────┼───────────────┤
│ mfscli2prom                     │ OK                         │ Program       │
└─────────────────────────────────┴────────────────────────────┴───────────────┘
4.Check for generated files under /var/log/prometheus/
/var/log/prometheus/mfscli.prom
5.Check whether moosefs metrics are generated in node_exporter
···
# HELP moosefs_active_quotas_current_inodes Metric read from /var/log/prometheus/mfscli.prom
# TYPE moosefs_active_quotas_current_inodes untyped
moosefs_active_quotas_current_inodes{path="mfs_path_1"} 760242
moosefs_active_quotas_current_inodes{path="mfs_path_2"} 295
moosefs_active_quotas_current_inodes{path="mfs_path_3"} 761
···
Data source config
Collector type:
Collector plugins:
Collector config:
Revisions
Upload an updated version of an exported dashboard.json file from Grafana
| Revision | Description | Created | |
|---|---|---|---|
| Download |