Kubernetes Cluster Monitoring
https://em8g.com - free kubernetes monitoring
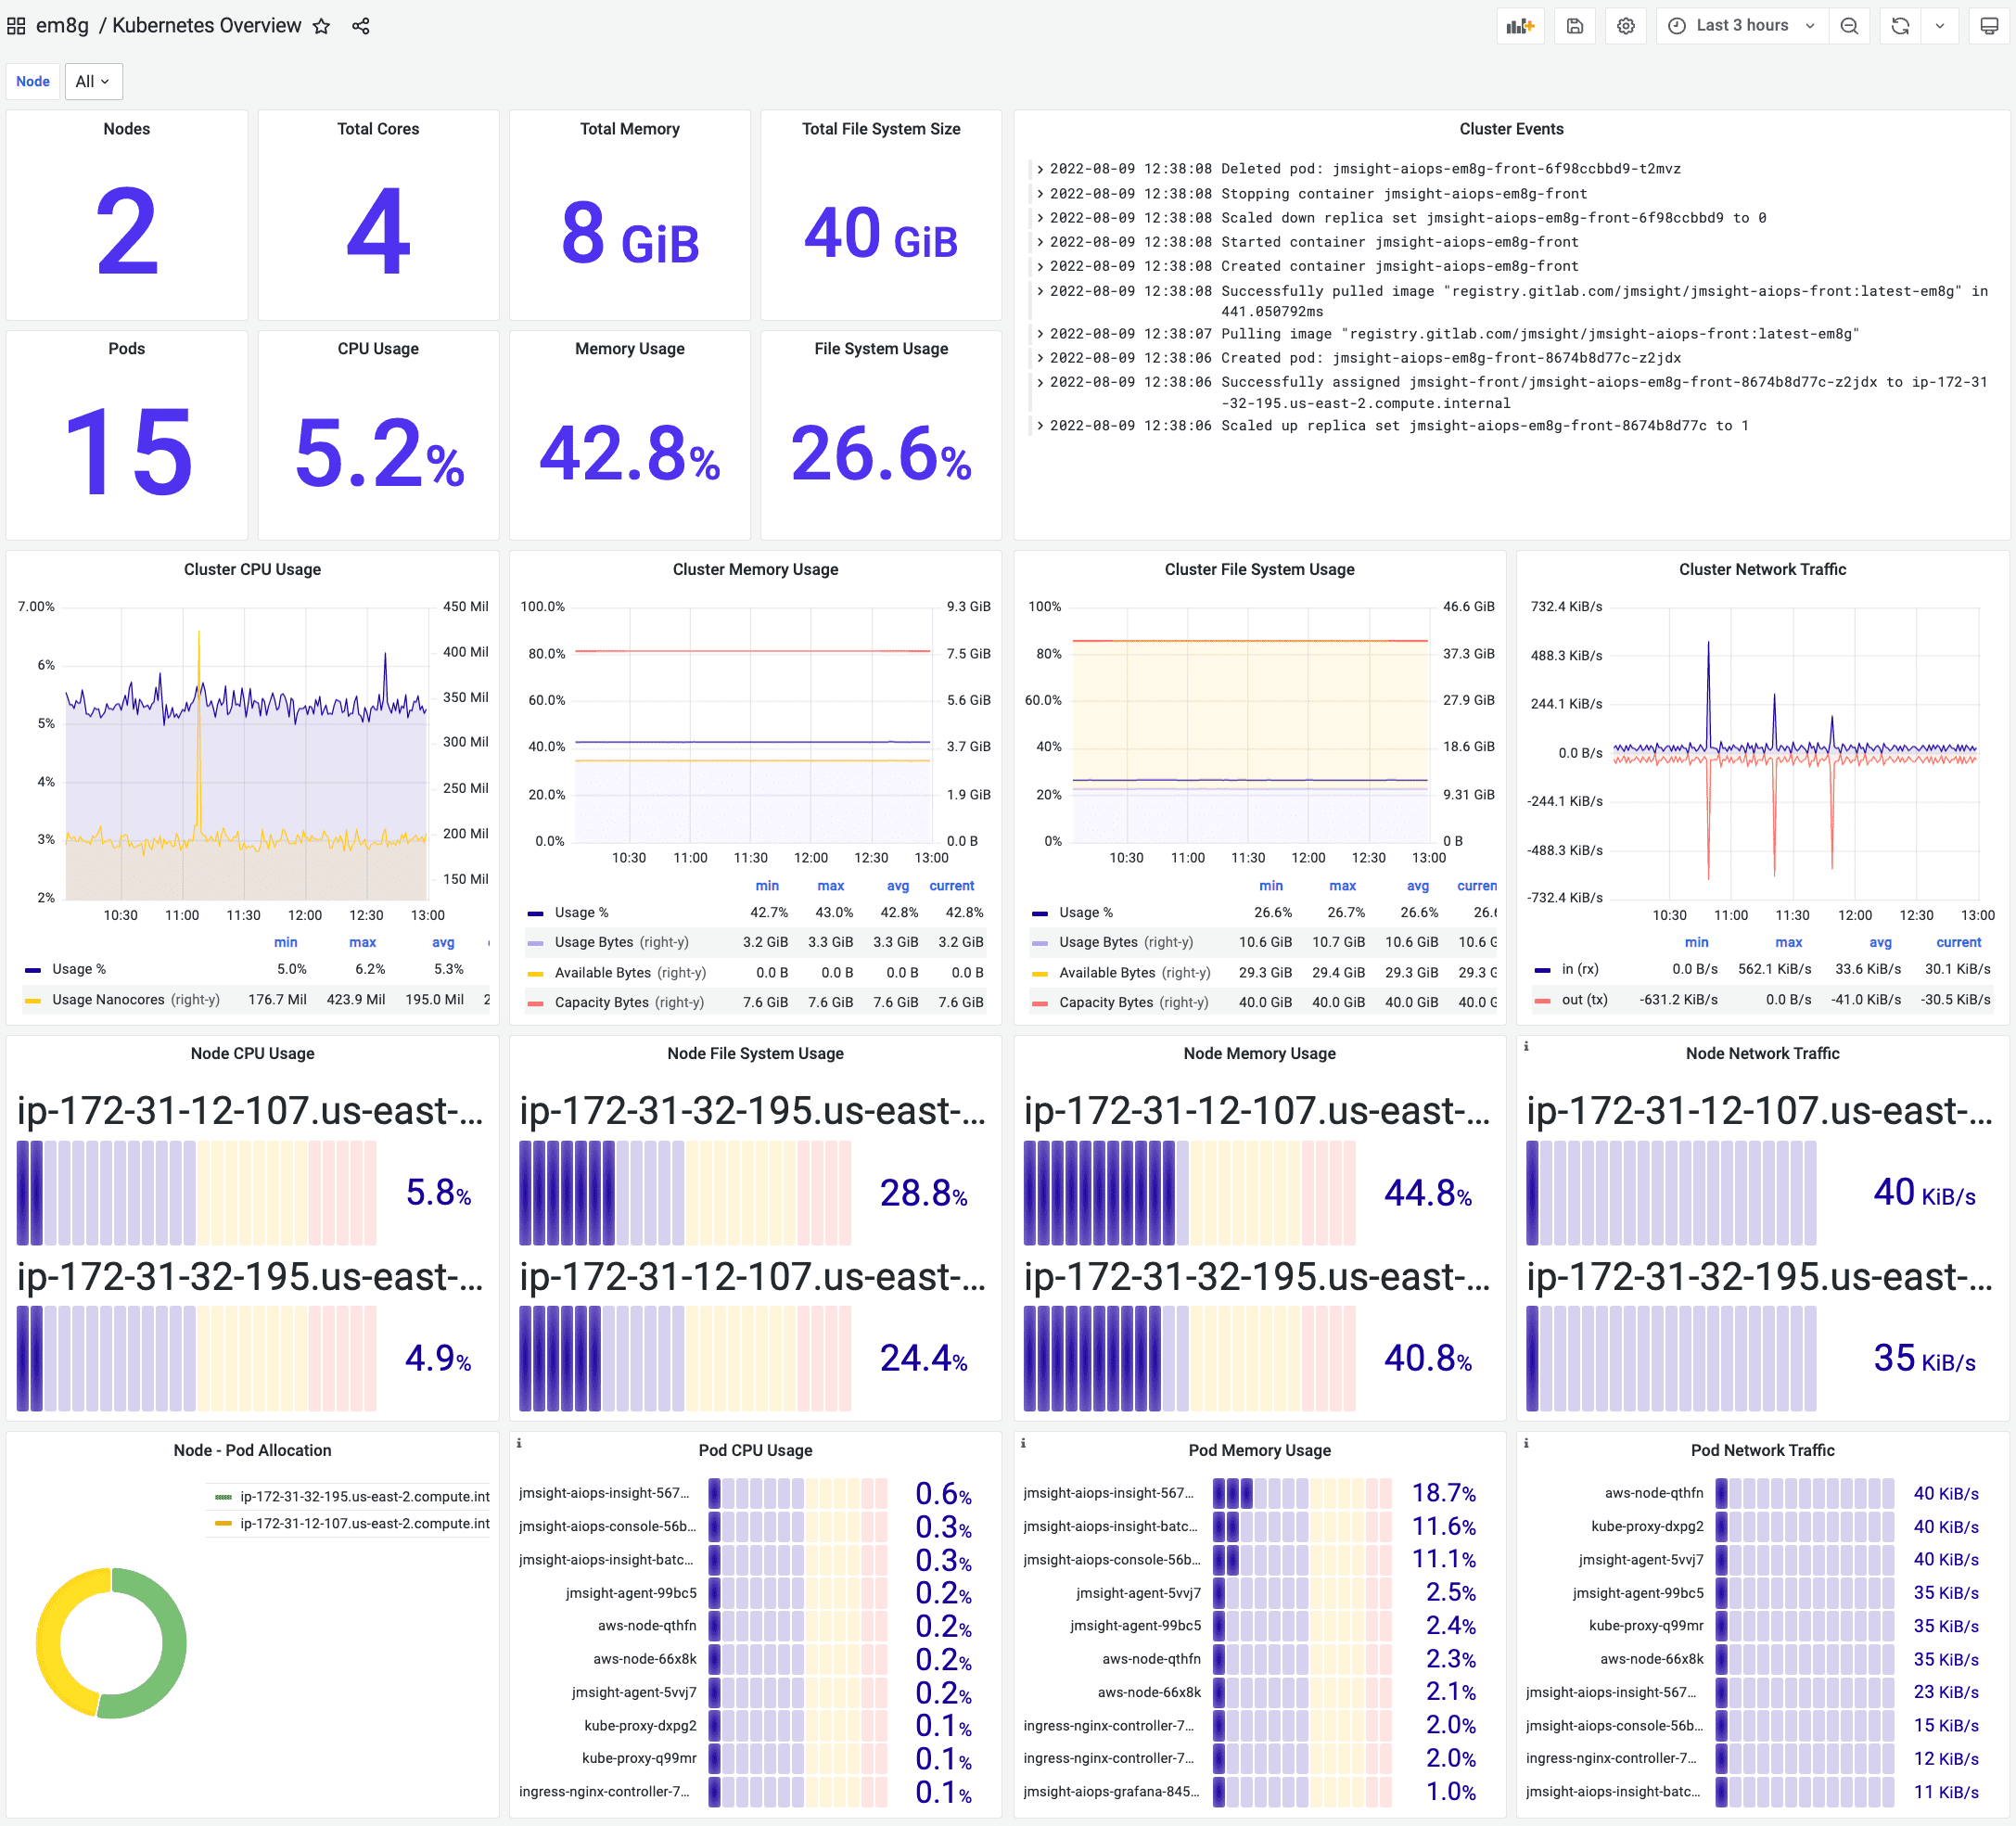
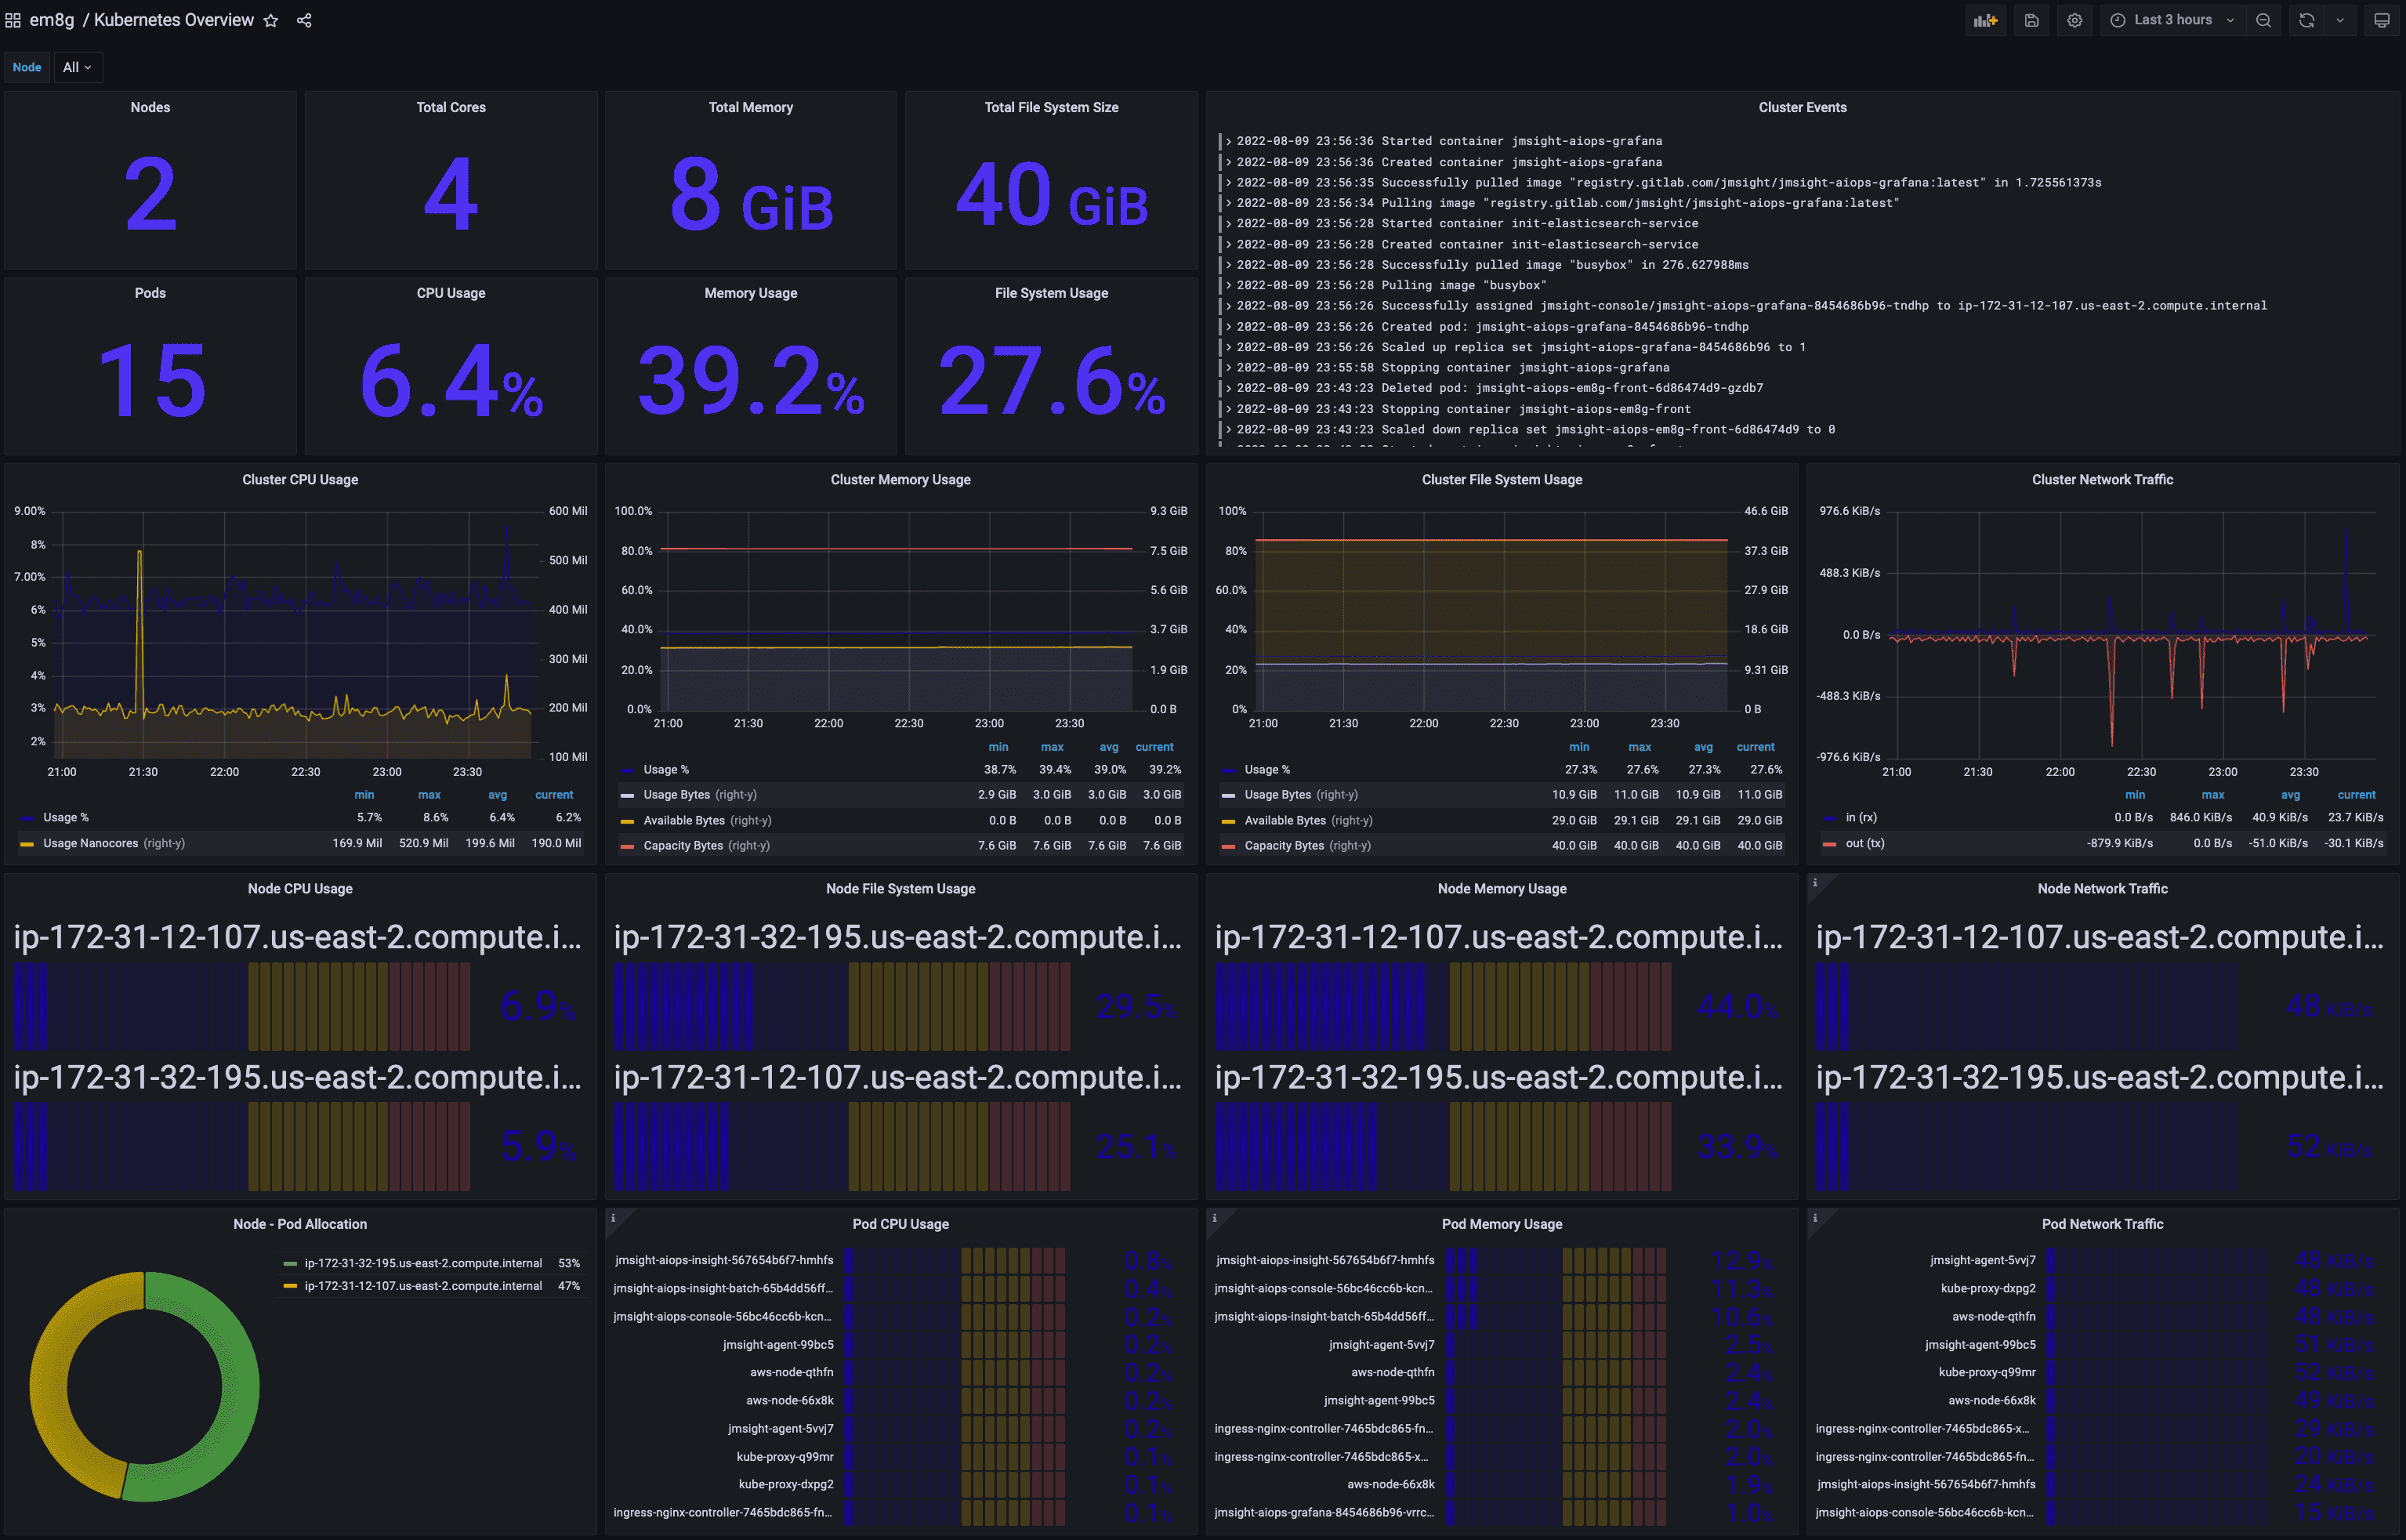
Kubernetes Cluster Monitoring Dashboard
- Number of Nodes, Cores, Pods In Cluster
- Total Size of Memory, File System In Cluster
- Usage % of CPU, Memory, File System In Cluster
- Events Summary In Cluster
- Usage Trend of CPU, Memory, File System, Network In Cluster
- Top Nodes each a CPU, Memory, File System, Network In Cluster
- Pod Allocation % of Nodes
- Top Pods each a CPU, Memory, Network In Cluster
Learn more about
You should download as well the next dashboards for kubernetes visibility:
- Kubernetes Node Monitoring Dashboard
- Kubernetes Pod Monitoring Dashboard
- Kubernetes Event Monitoring Dashboard
JMSIGHT's Kubernetes Examples
Examples to test JMSIGHT's em8g that is a Monitoring SaaS for Kubernetes.
Directory contents
1. Deploying WordPress in Cloud Native with Kubernetes
Example of deploying to the Cloud Native of various cloud(ncloud, aws, etc.) based on Example: Deploying WordPress and MySQL with Persistent Volumes
2. Open Source Kubernetes Monitoring
Complete Guide to build Kubernetes Monitoring with open sources (Grafana + Elasticsearch + Metricbeat)
3. Kubernetes APM
Kubernetes Application Monitoring (APM) which monitors IT service based on Microservices in Kubernetes.
Data source config
Collector config:
Upload an updated version of an exported dashboard.json file from Grafana
| Revision | Description | Created | |
|---|---|---|---|
| Download |
Kubernetes
Monitor your Kubernetes deployment with prebuilt visualizations that allow you to drill down from a high-level cluster overview to pod-specific details in minutes.
Learn more

