K8s Cluster Summary
shows the actual pods resources usage (cpu and memory) over time multi select of namespace and nodes. it helps me understand the cost of each namespaces and wrong requests configuration per namespace. works with kube-prometheus-stack-36
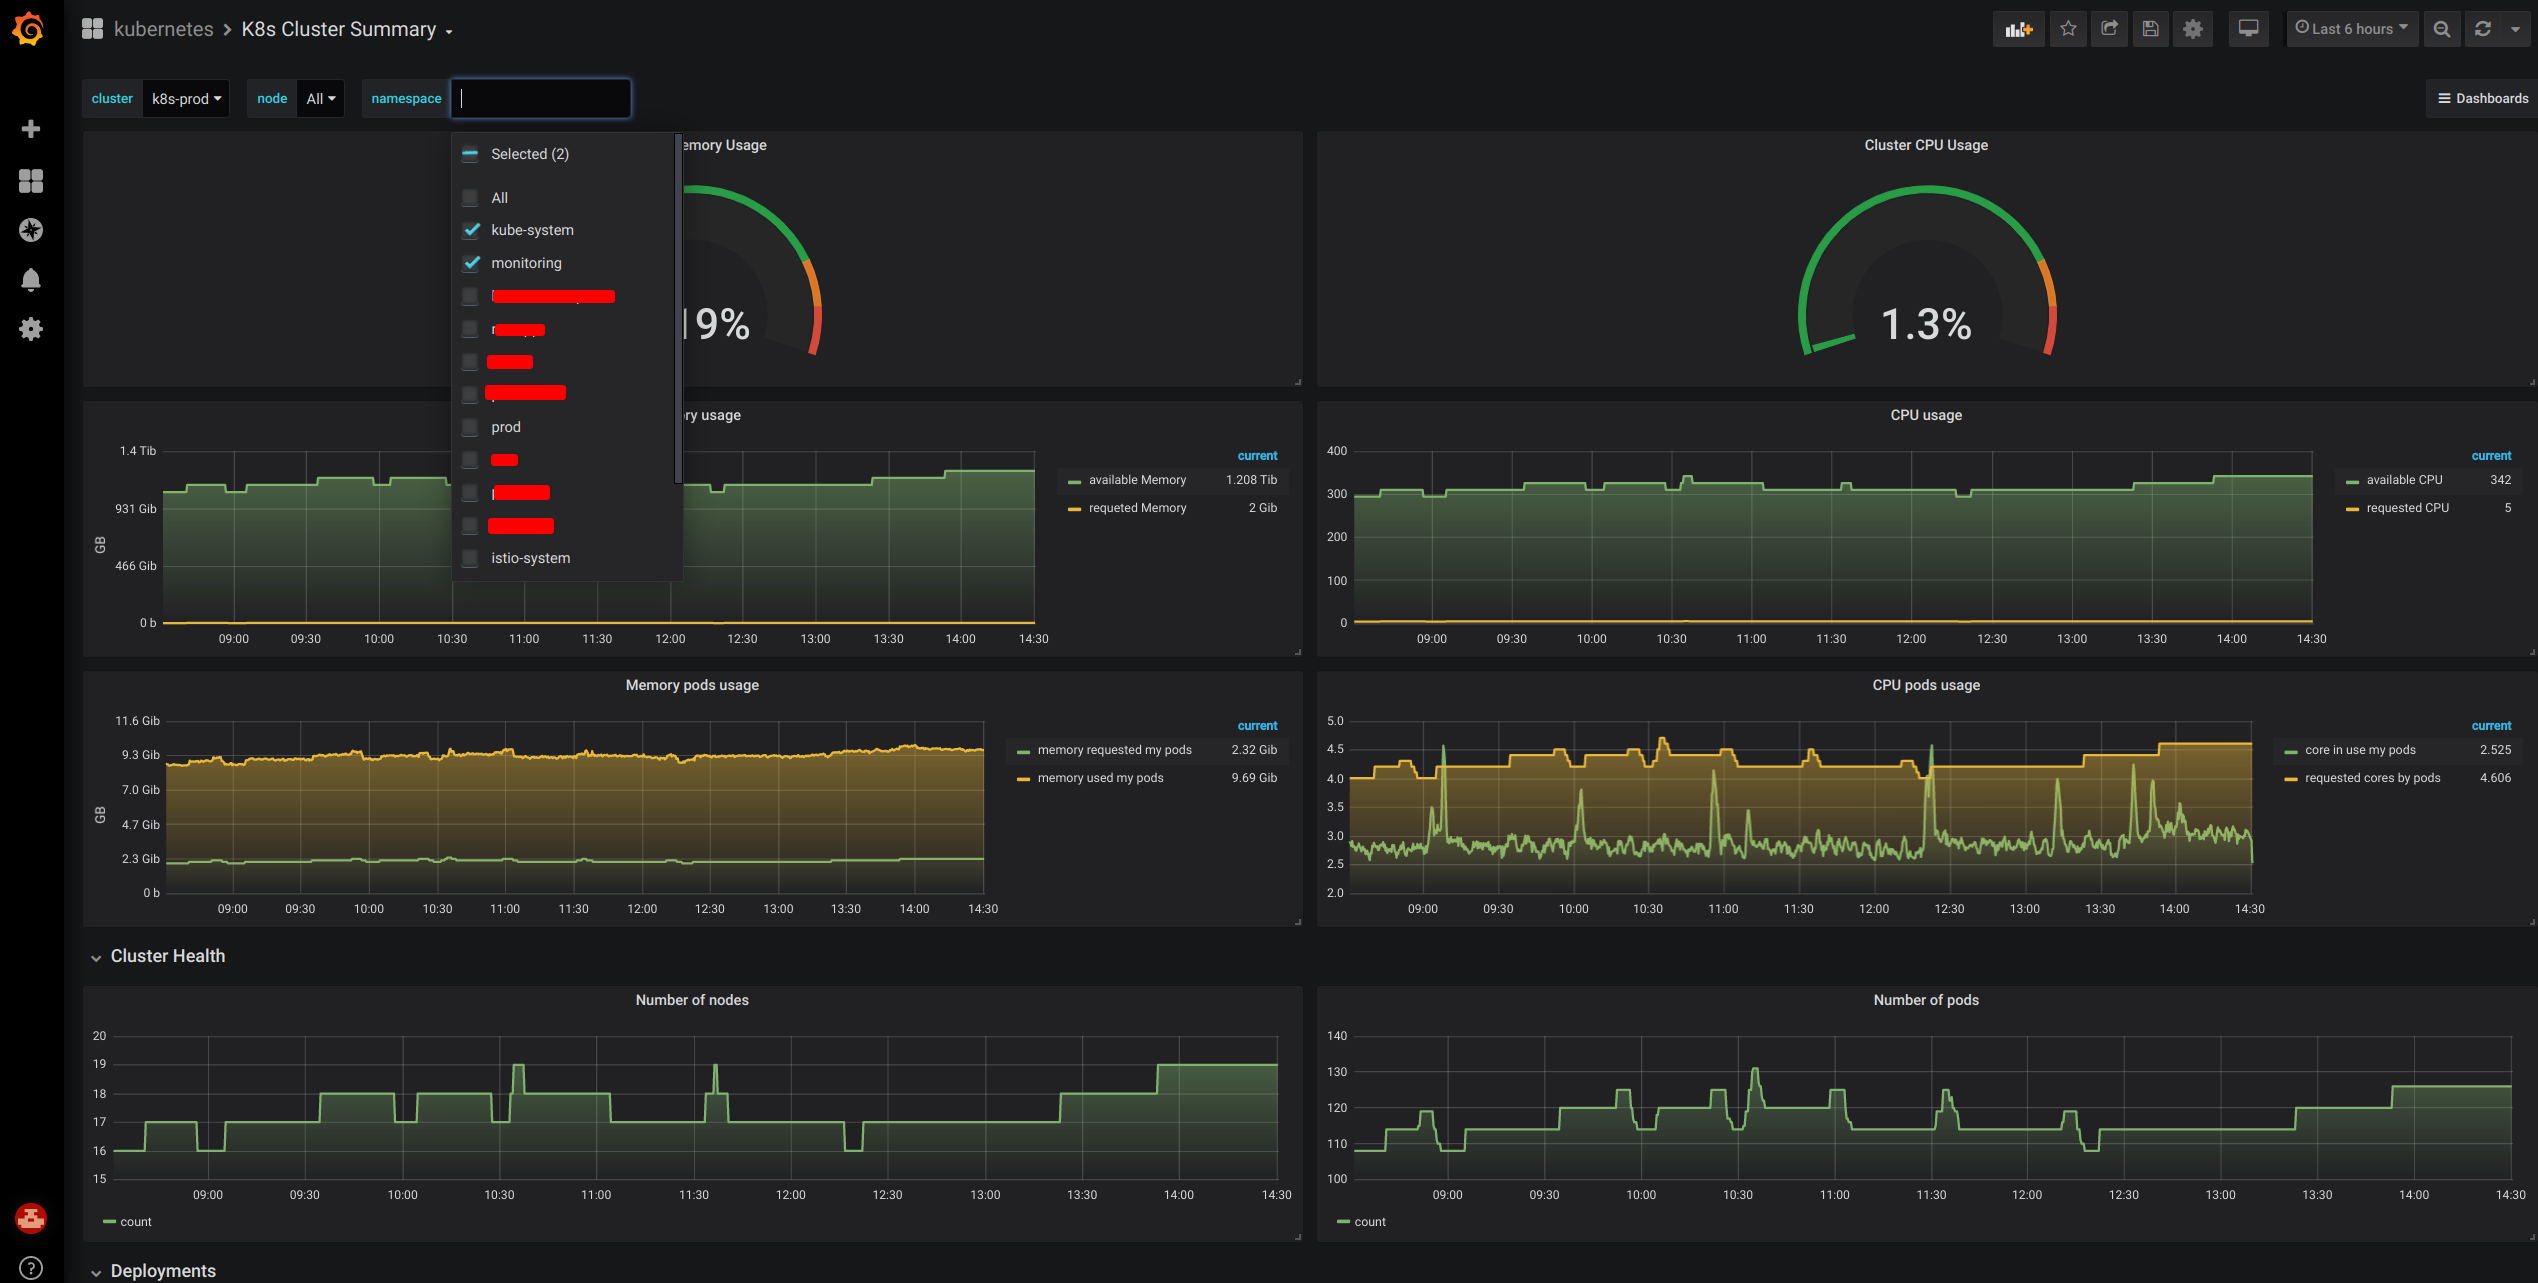
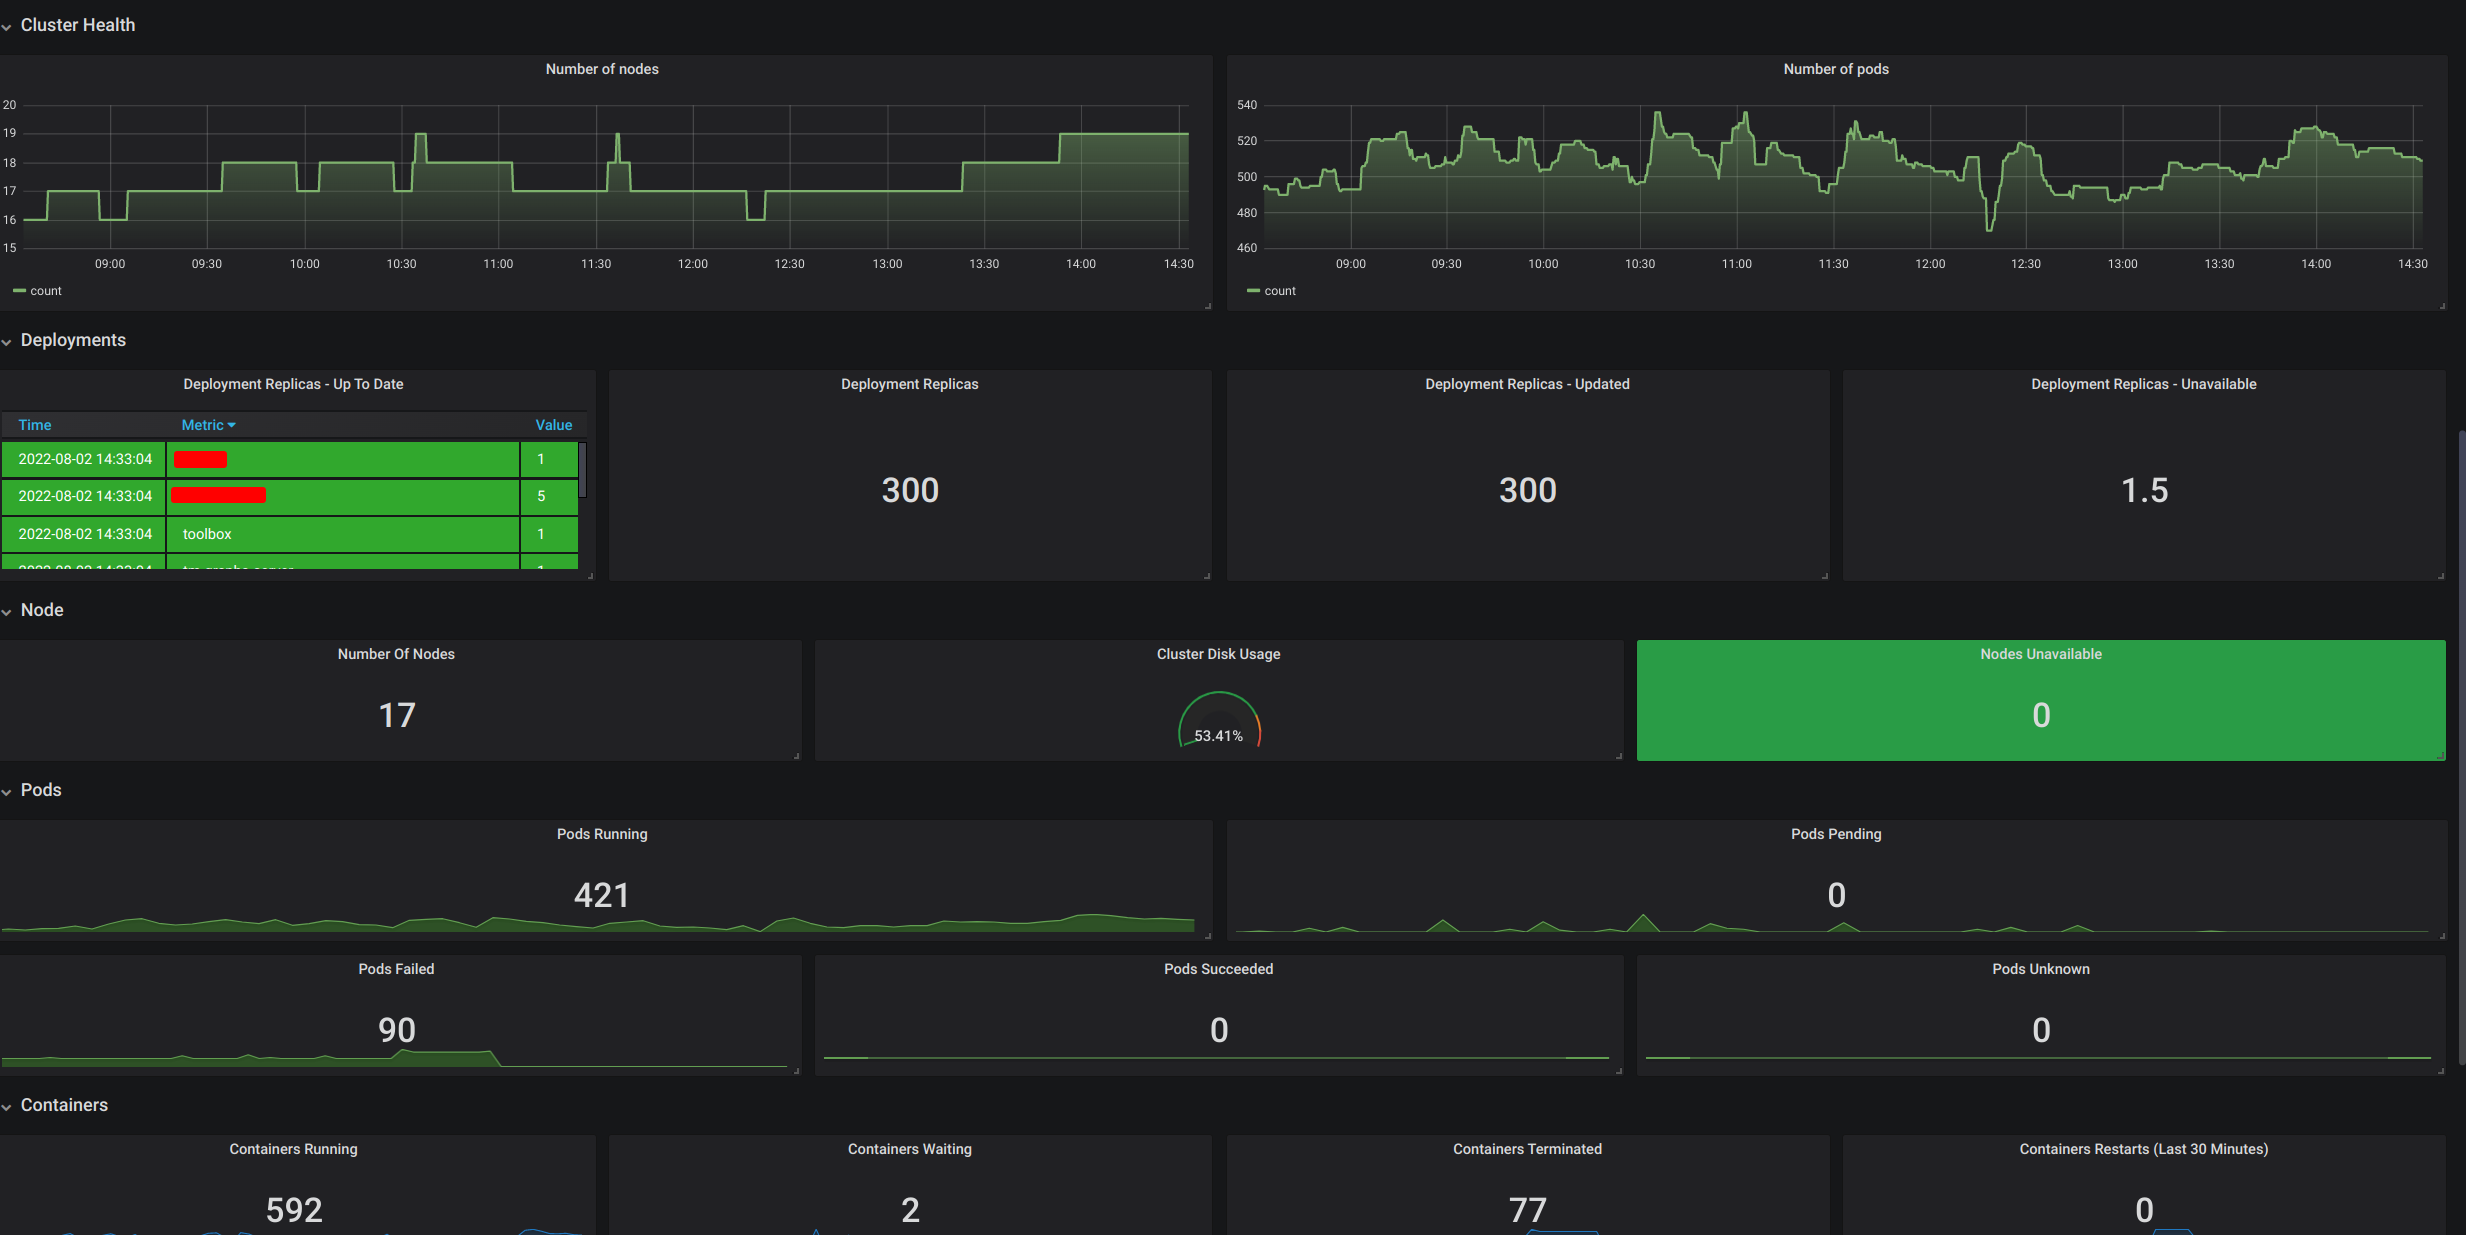
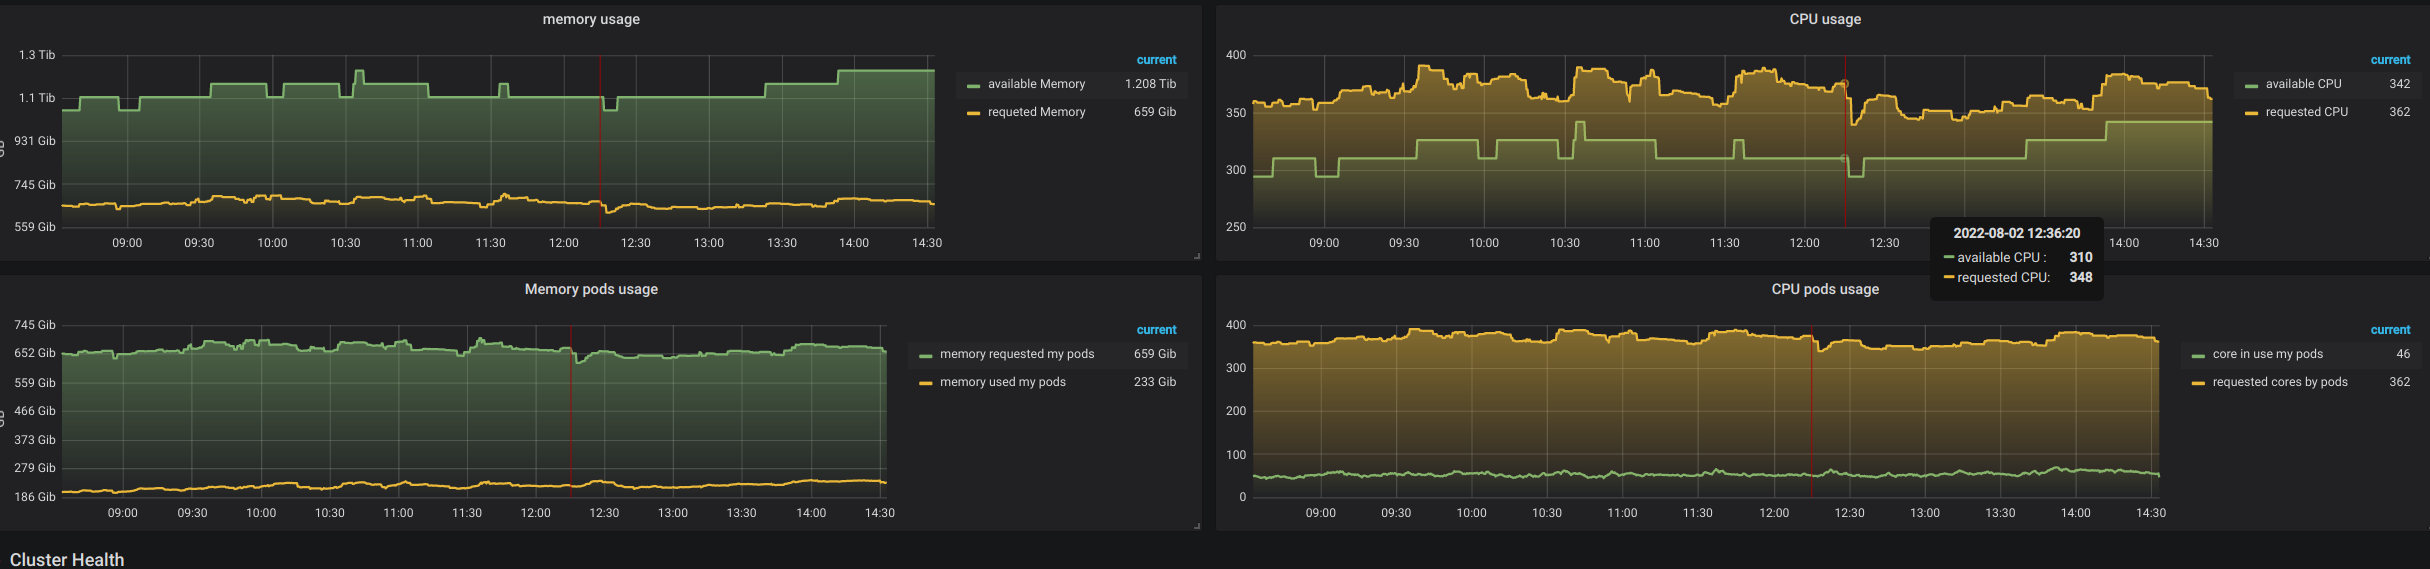
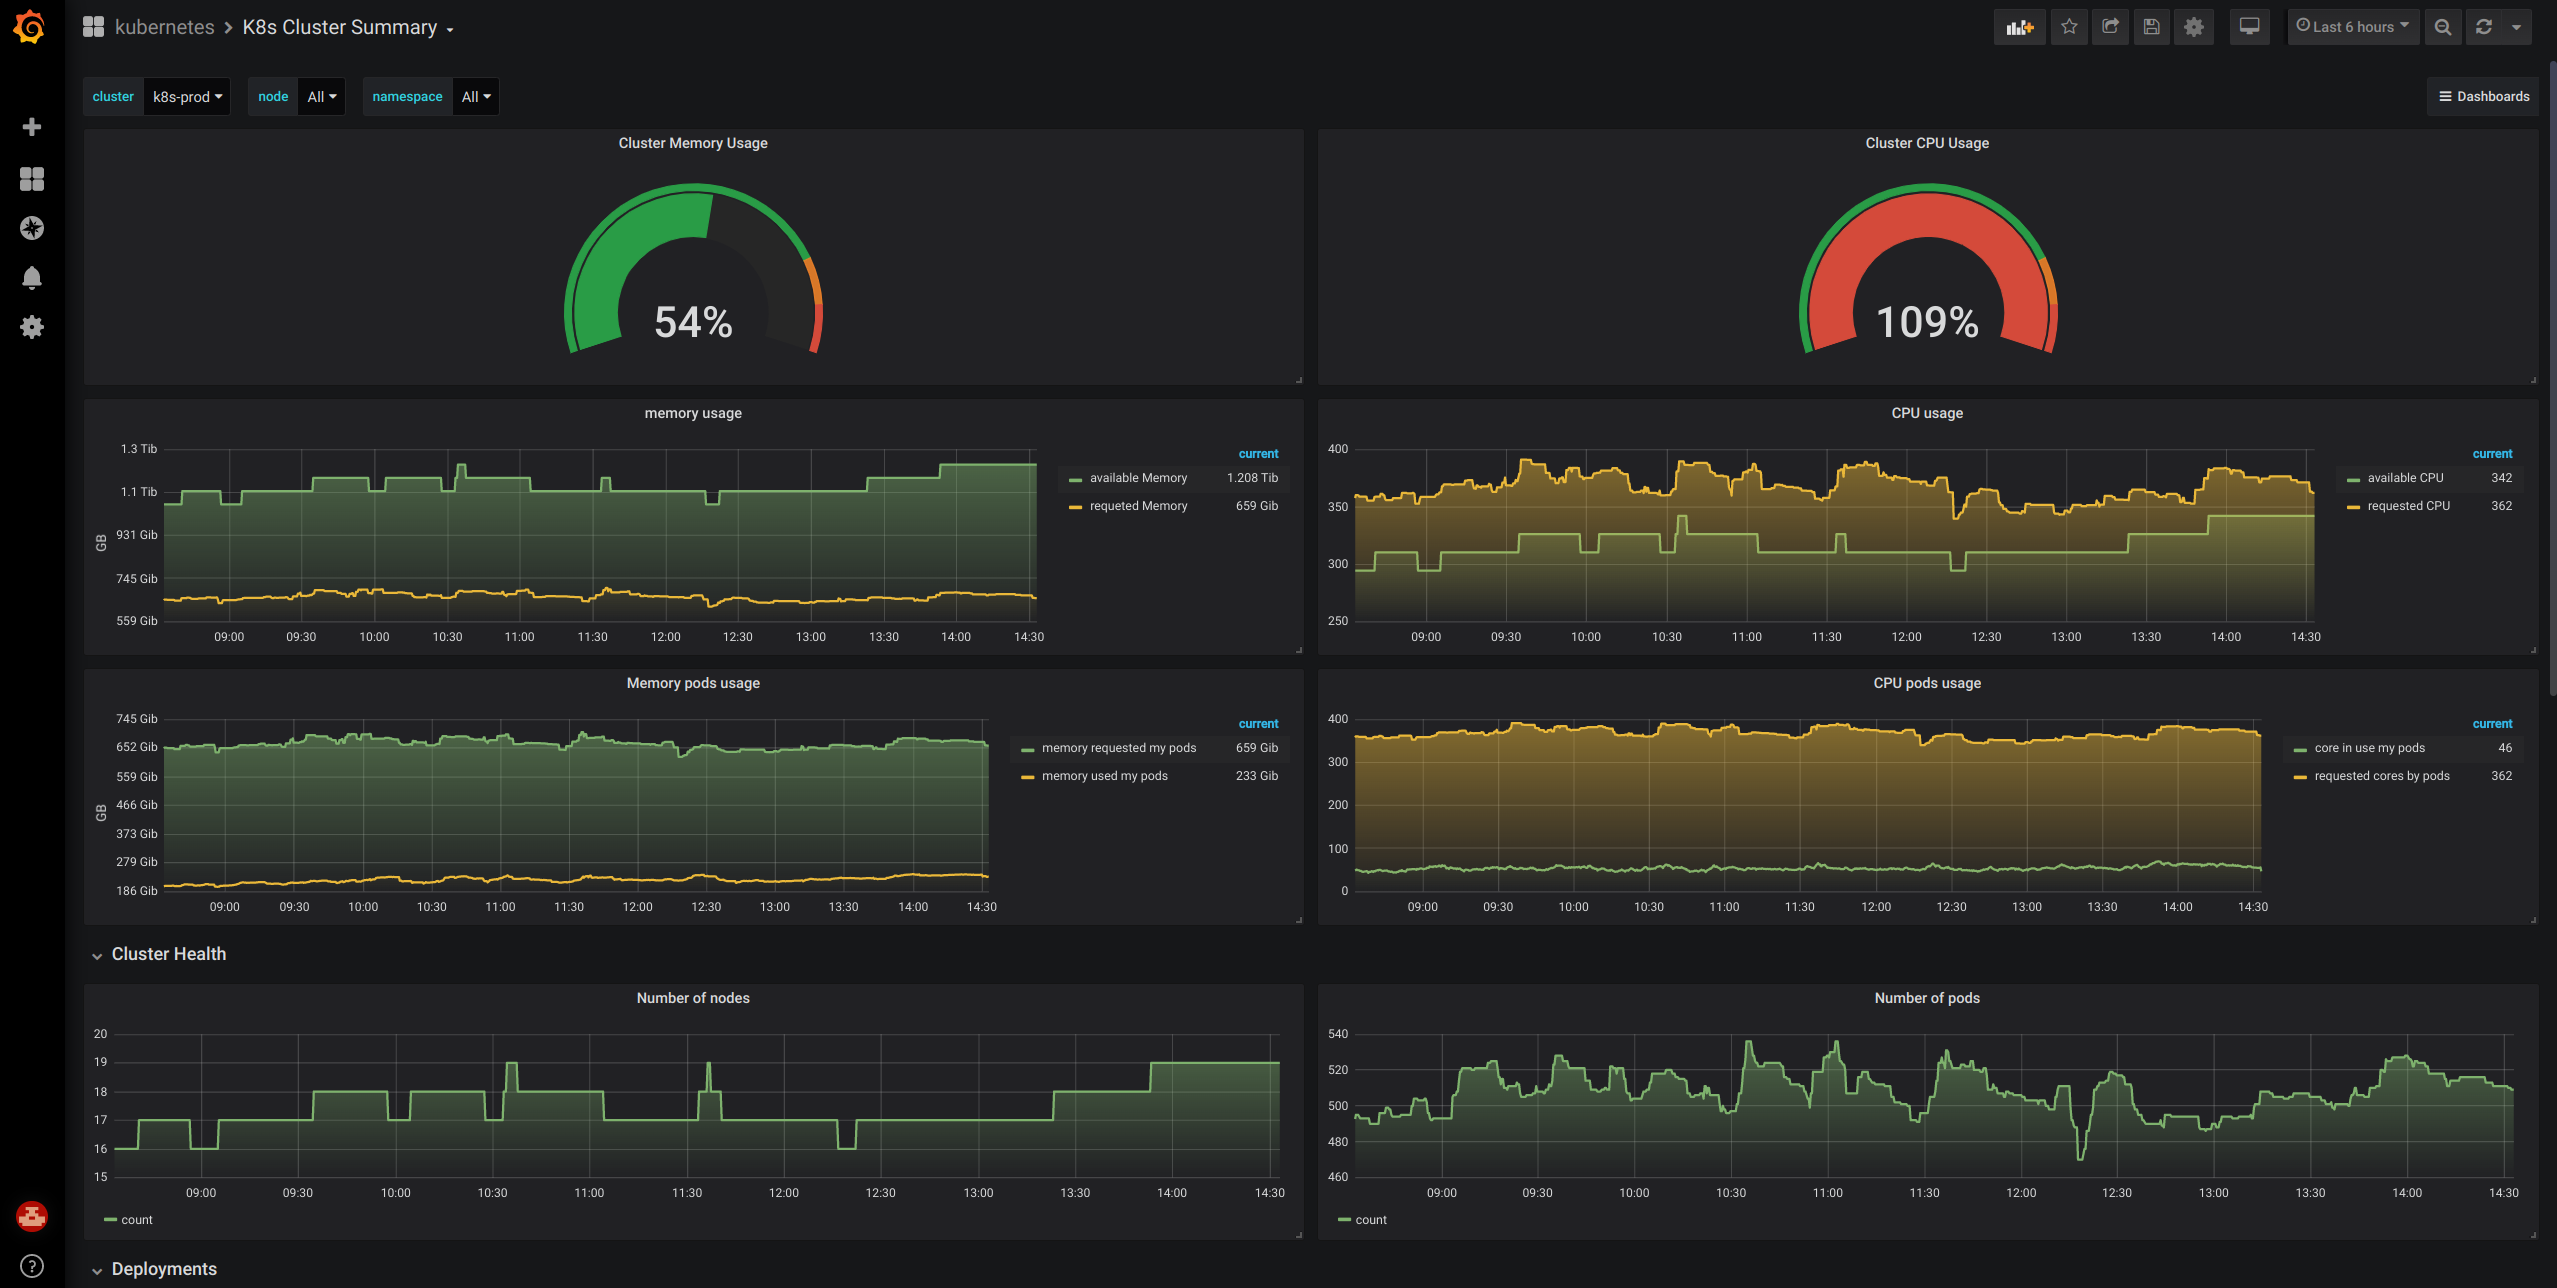
The K8s Cluster Summary dashboard uses the prometheus data source to create a Grafana dashboard with the graph, singlestat and table panels.
Data source config
Collector type:
Collector plugins:
Collector config:
Revisions
Upload an updated version of an exported dashboard.json file from Grafana
| Revision | Description | Created | |
|---|---|---|---|
| Download |
Kubernetes
Monitor your Kubernetes deployment with prebuilt visualizations that allow you to drill down from a high-level cluster overview to pod-specific details in minutes.
Learn more