
Grafana self-monitoring over InfluxDB
Use Telegraf to collect metrics, InfluxDB OSS 2.x to store them
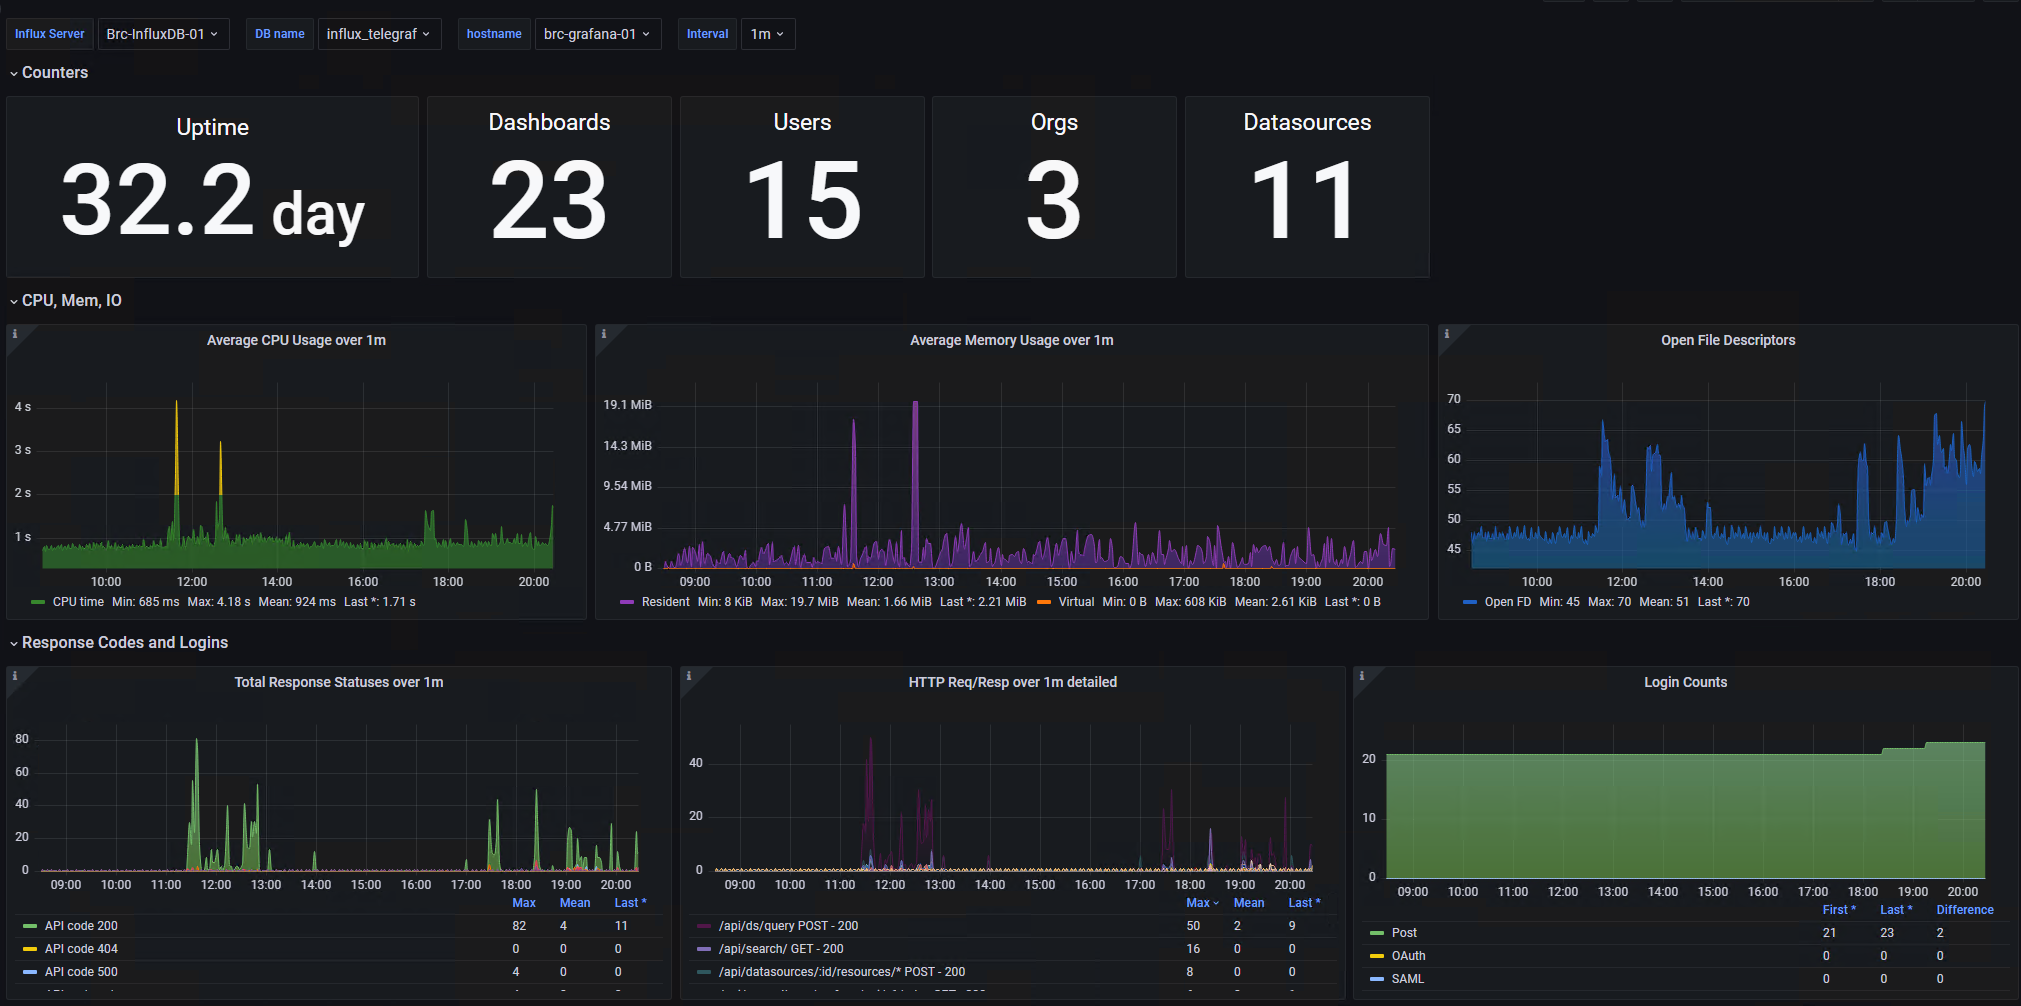
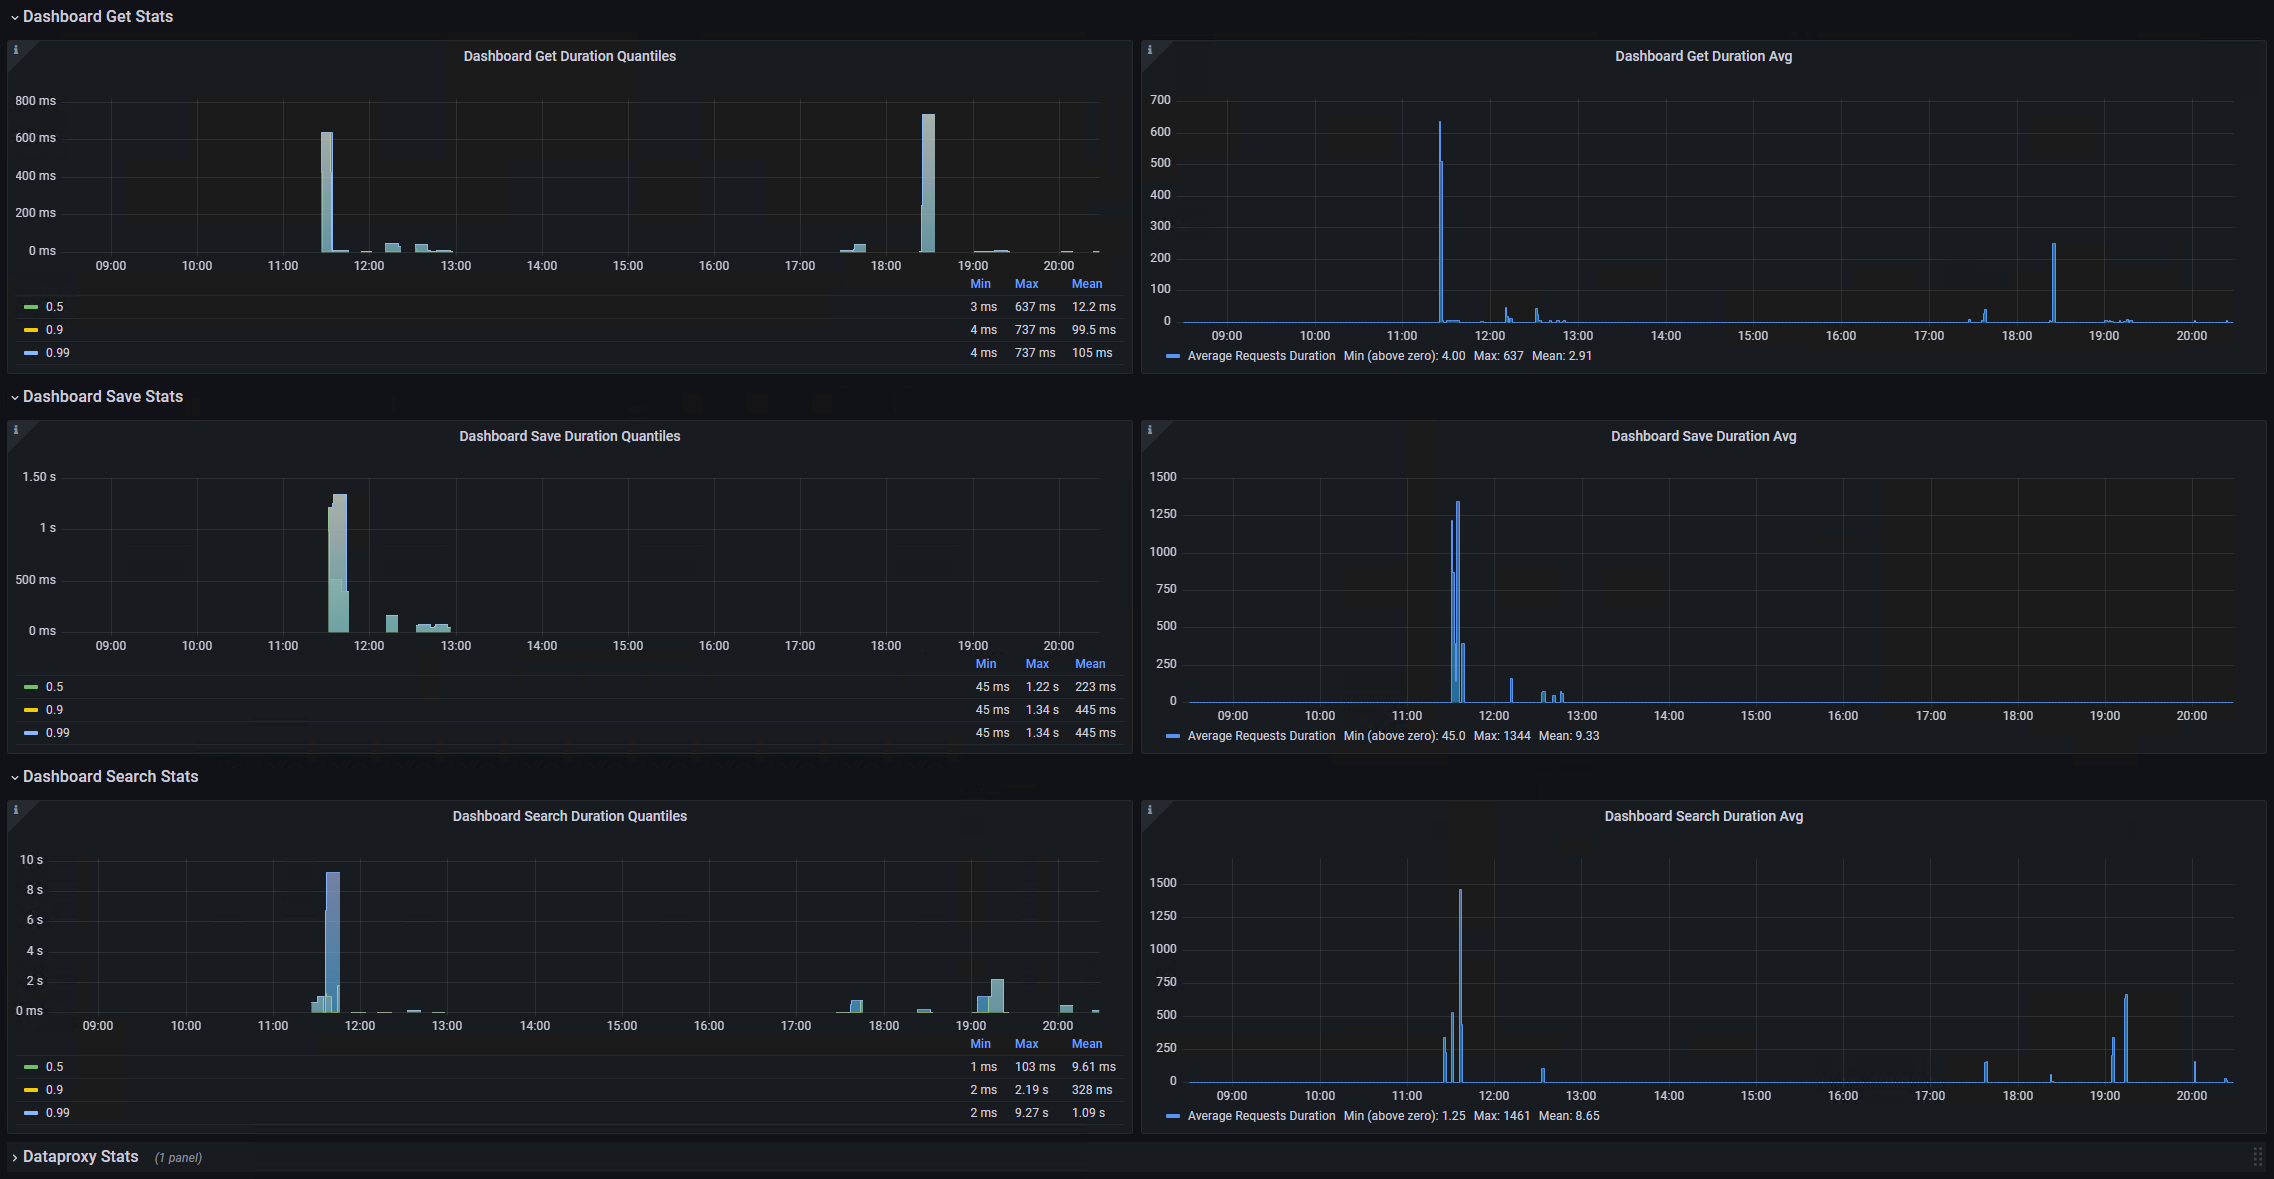
Slightly reworked version of Grafana Internals
- Telegraf (on any host) collecting data from Grafana's native (on by default) Prometheus endpoint
- Push them to InfluxDB OSS 2.x (tested on v2.3)
- Same or other Grafana allow you to choose any flux-compartible datasource and show basic stats, aggregated over variable-defined intervals
I don't use proxy right now, so this part is not finished. But you can re-use "Dashboards X Stats" pattern to get same result.
Data source config
Collector type:
Collector plugins:
Collector config:
Revisions
Upload an updated version of an exported dashboard.json file from Grafana
| Revision | Description | Created | |
|---|---|---|---|
| Download |
InfluxDB
Easily monitor InfluxDB, an open source time series database, with Grafana Cloud's out-of-the-box monitoring solution.
Learn more