Jenkins: Performance and Job Details
Jobs queue speeds and rates, Executors availability, Nodes status, Jenkins and JVM resource usage, Jenkins Job Status, and lot more.
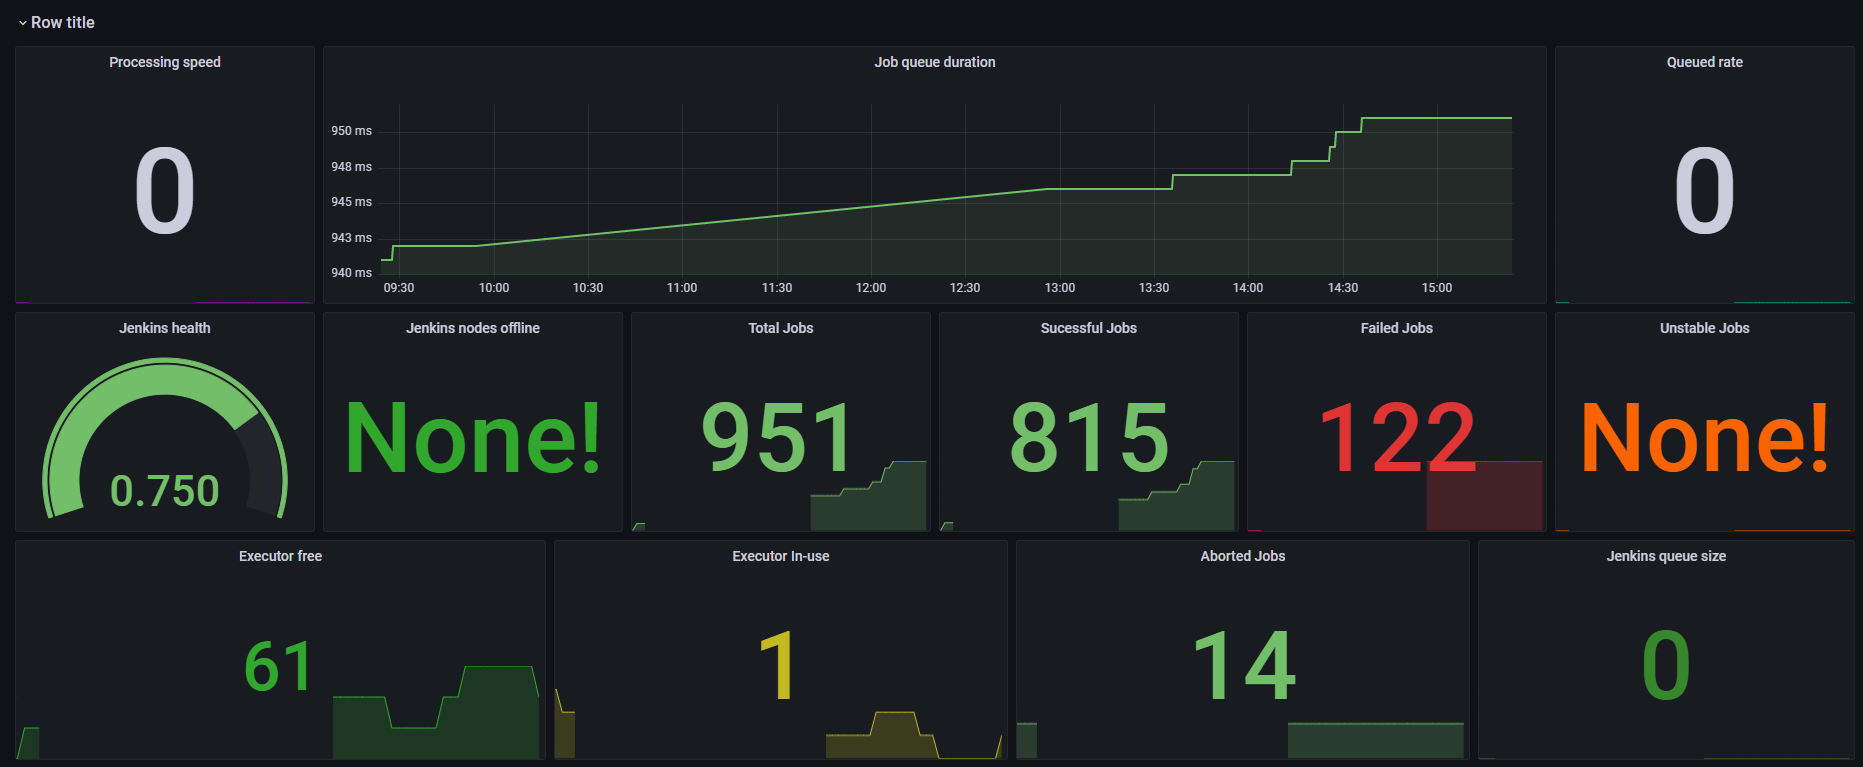
The Jenkins: Performance and Job Details dashboard uses the prometheus data source to create a Grafana dashboard with the gauge, graph, stat, table and timeseries panels.
Data source config
Collector type:
Collector plugins:
Collector config:
Revisions
Upload an updated version of an exported dashboard.json file from Grafana
| Revision | Description | Created | |
|---|---|---|---|
| Download |