CloudWatch Exporter
Dashboard for Amazon CloudWatch exporter with prometheus
AWS Monitoring with cloudwatch exporter
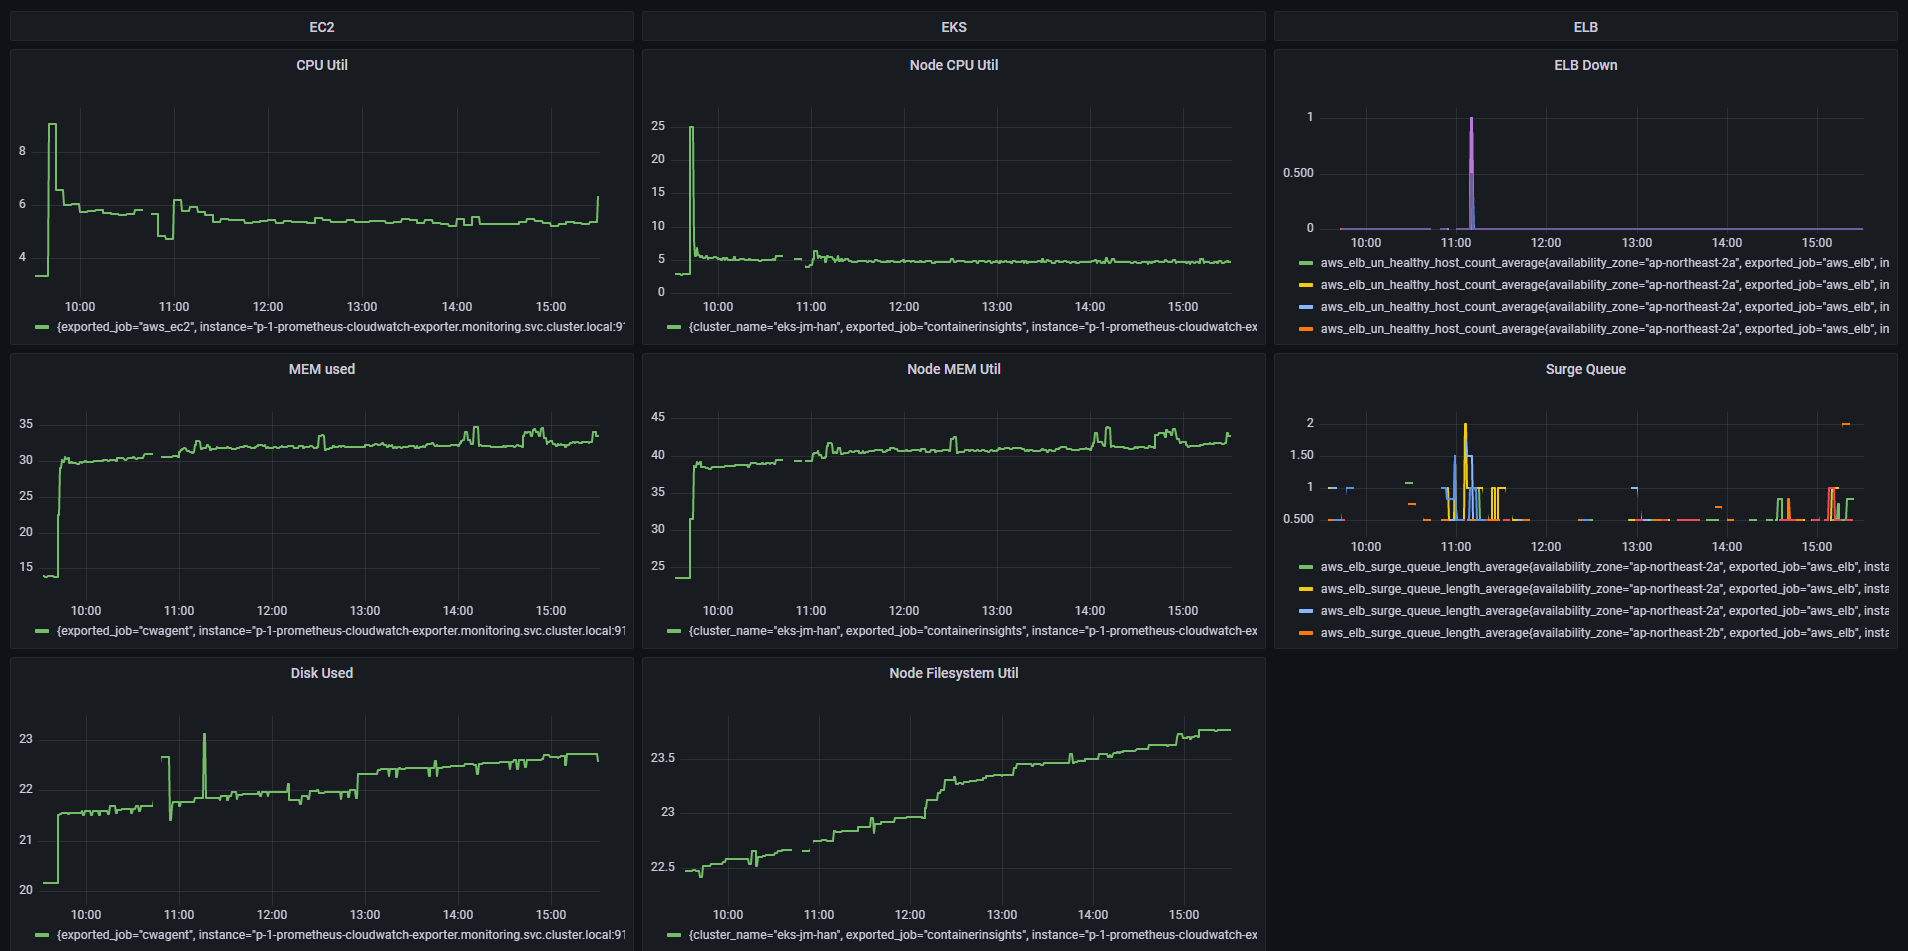
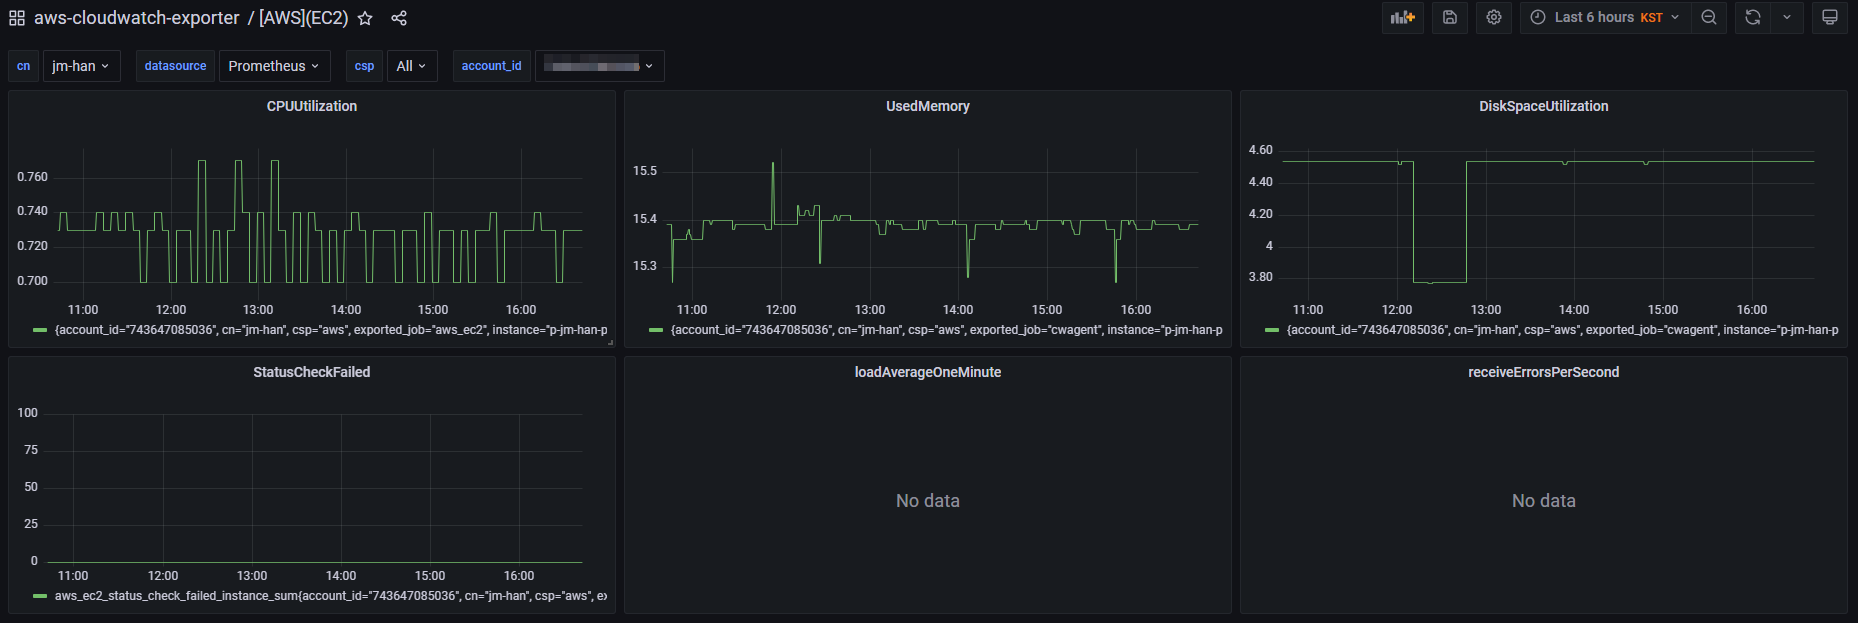
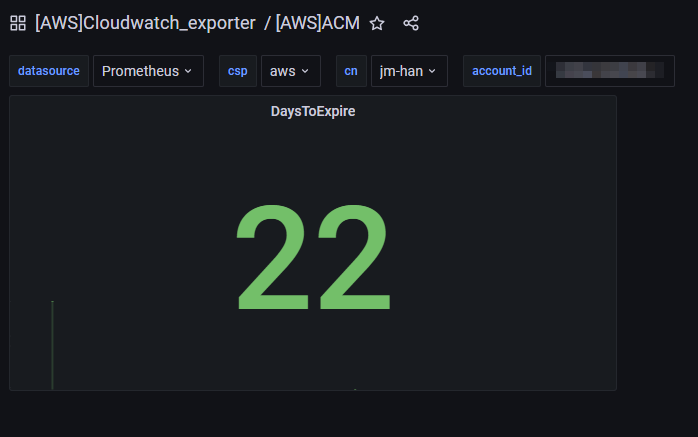
Target: EC2, EKS, ELB(ALB,NLB,CLB), ElastiCache, RDS, VPC, ACM
You have to add label(csp,cn,account_id) to prometheus job, for instance
    - job_name: cloudwatch-exporter
      static_configs:
      - targets:
        - [exporter domain]
        labels:
          csp: 'aws'
          cn: 'company_name'
          account_id: 'your_account_id'
Data source config
Collector config:
Upload an updated version of an exported dashboard.json file from Grafana
| Revision | Description | Created | |
|---|---|---|---|
| Download |


