
Windows Status - Prometheus
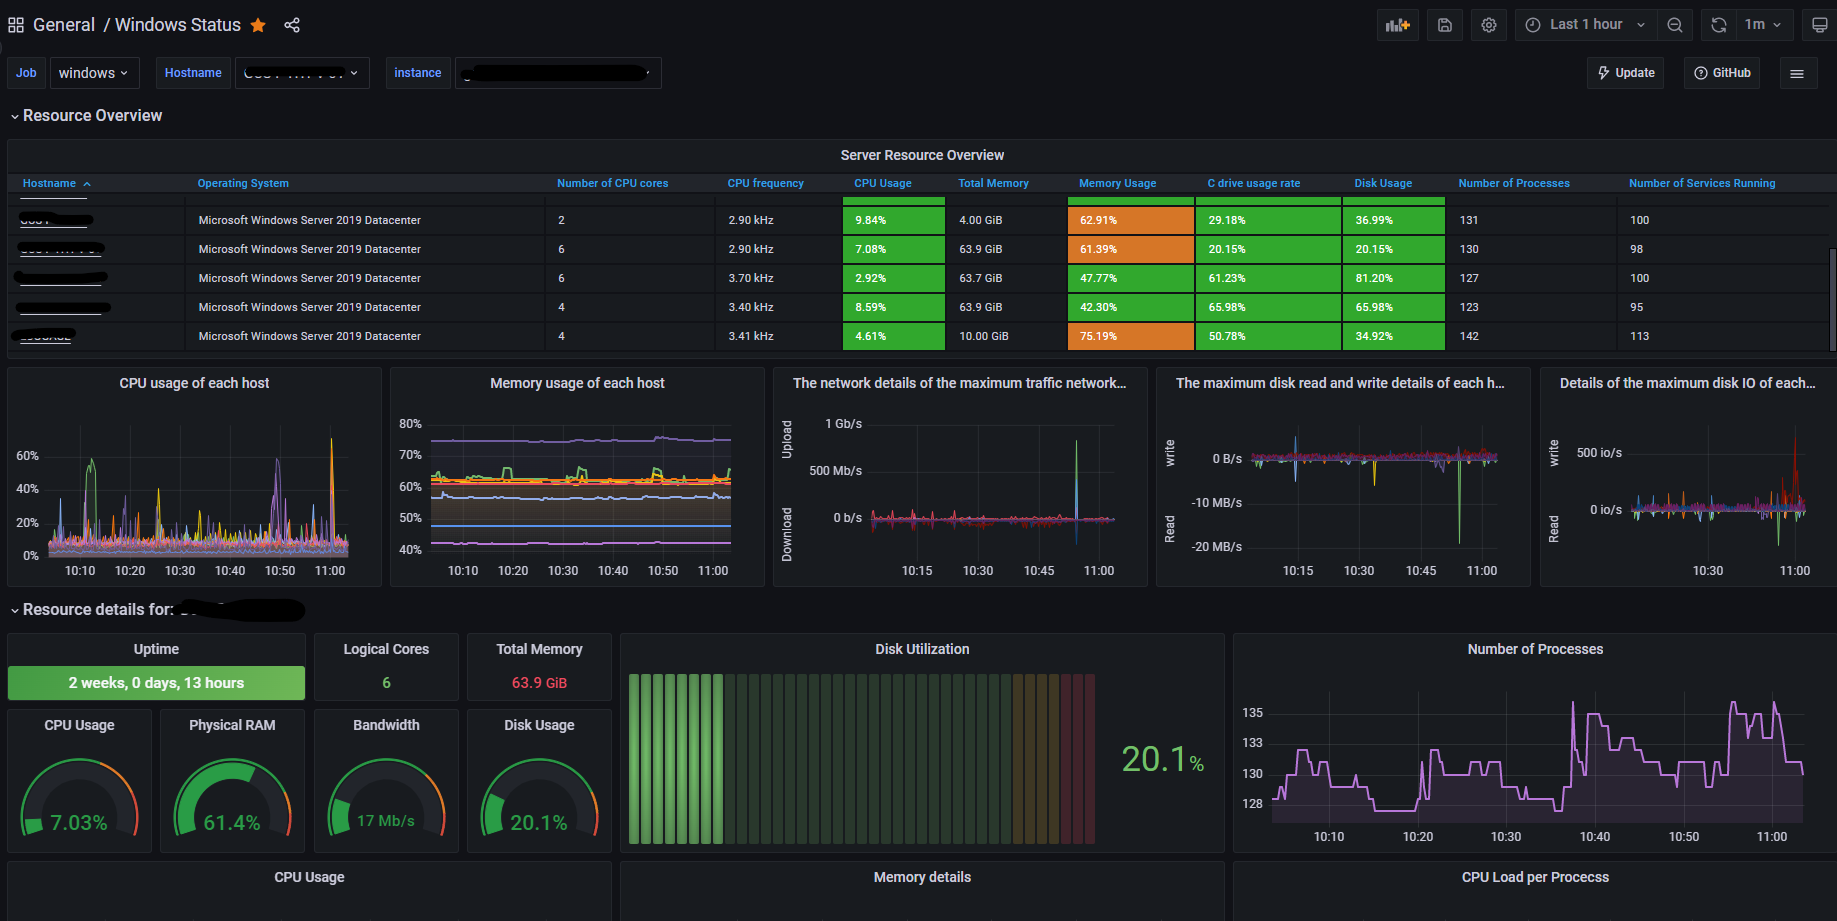
Overview Dashboard for Windows using Prometheus and Windows Exporter
Based on Dashboard ID: 13868.
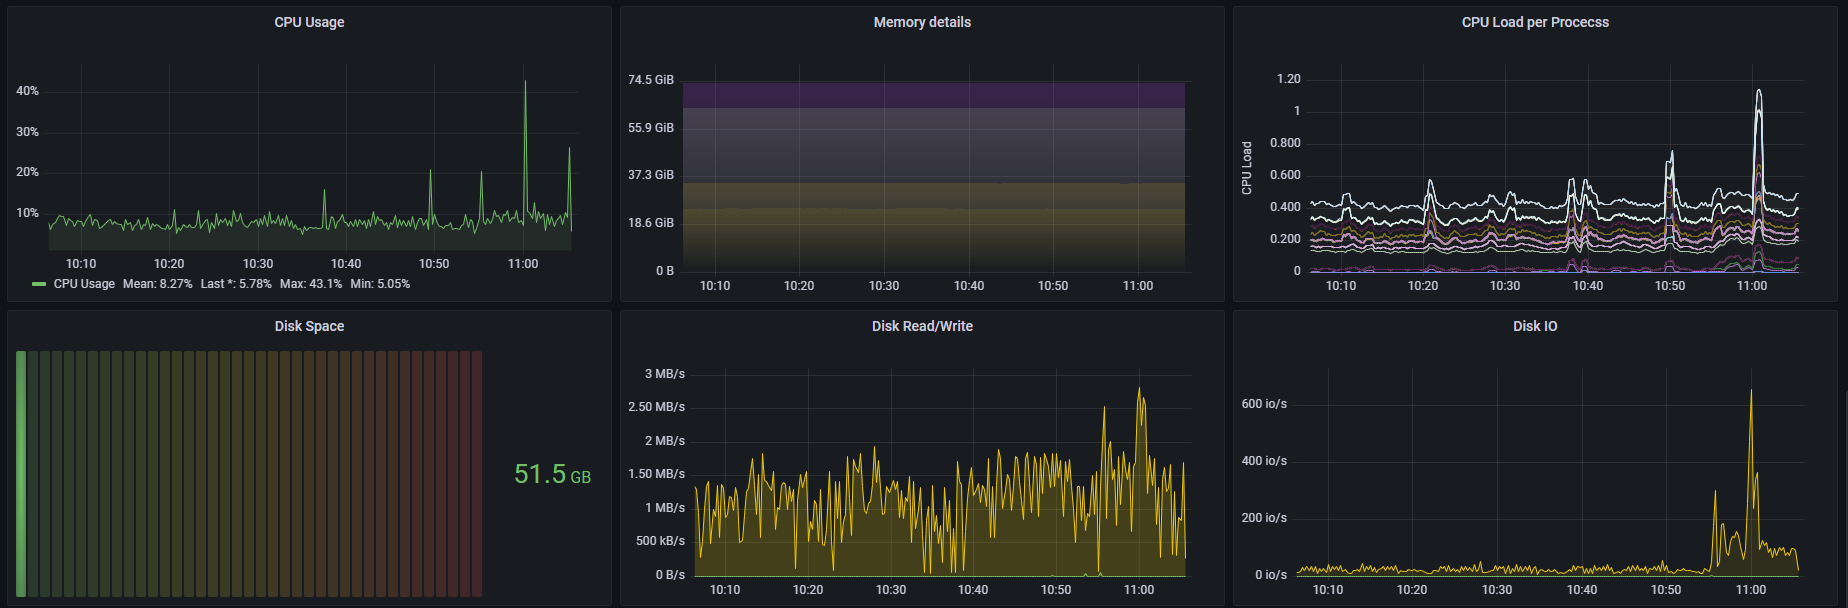
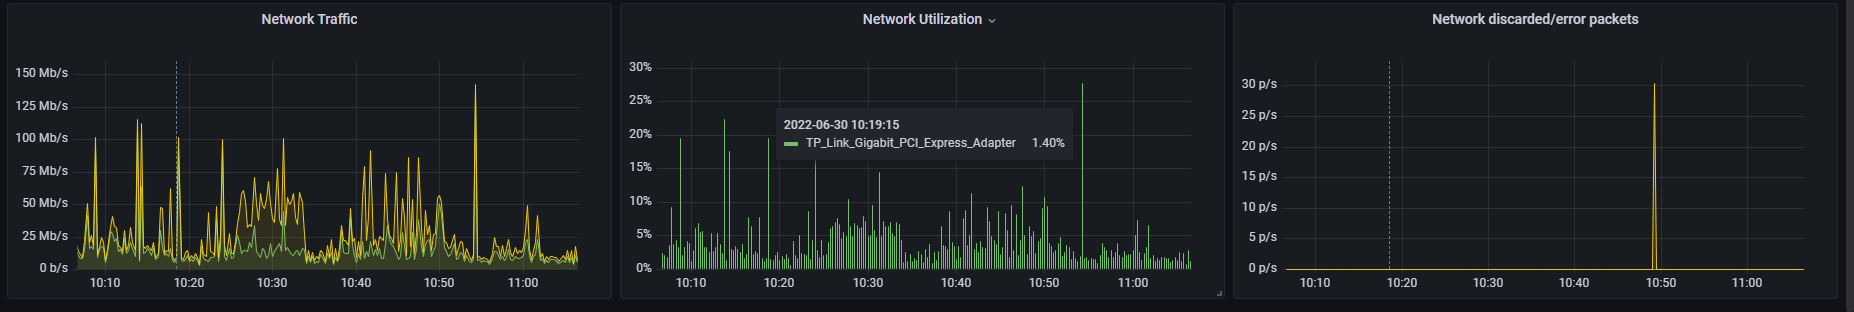
Top section has an overview of all Windows hosts, which are linked to see more detailed information underneath Tested on: Windows_Exporter 0.18.1 and Grafana 10.4.1
Revision 3: Upgraded Table panel to latest version (2024-03-29) Revision 2: Fixed issue where “Update” link was incorrect (2022-07-17)
Data source config
Collector type:
Collector plugins:
Collector config:
Dashboard revisions
Upload an updated version of an exported dashboard.json file from Grafana
| Revision | Decscription | Created | |
|---|---|---|---|
| Download |
Sign up for Grafana Cloud

Get up and running in minutes with the Grafana Cloud free tier, which includes free forever 10k metrics, 50GB logs, 50GB traces, 500 VUh, and more.
Get this dashboard
Data source:
Dependencies: