Opstree/Mongodb Dashboard
MongoDB Dashboard with Cluster, Replication, cursor, and server metrics using Mongodb Exporter by percona
##MongoDB Dashboard This Dashboard depicts the metrics of Mongodb Cluster in replication mode using MongoDB Exporter. Following is the list of metrics we are monitoring.
##Prerequisite
- MongoDB Exporter
- Node Exporter
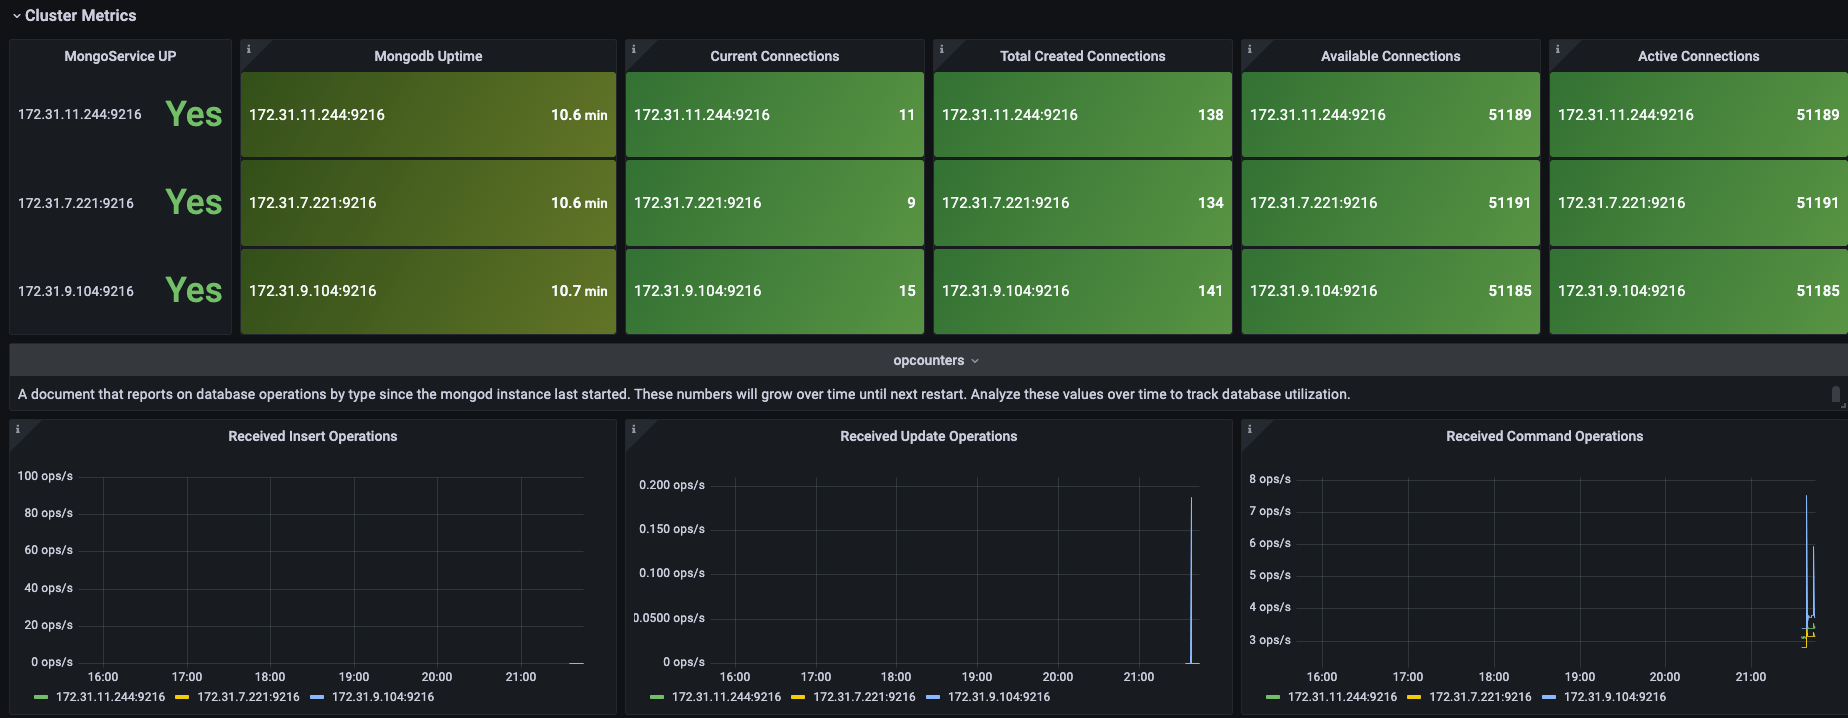
Cluster
- MongoDB Service UP
- MongoDB Uptime
- Current Connections
- Total Created Connections
- Available Connections
- Active Connections
- Received Insert Operations
- Received Update Operations
- Received Command Operations
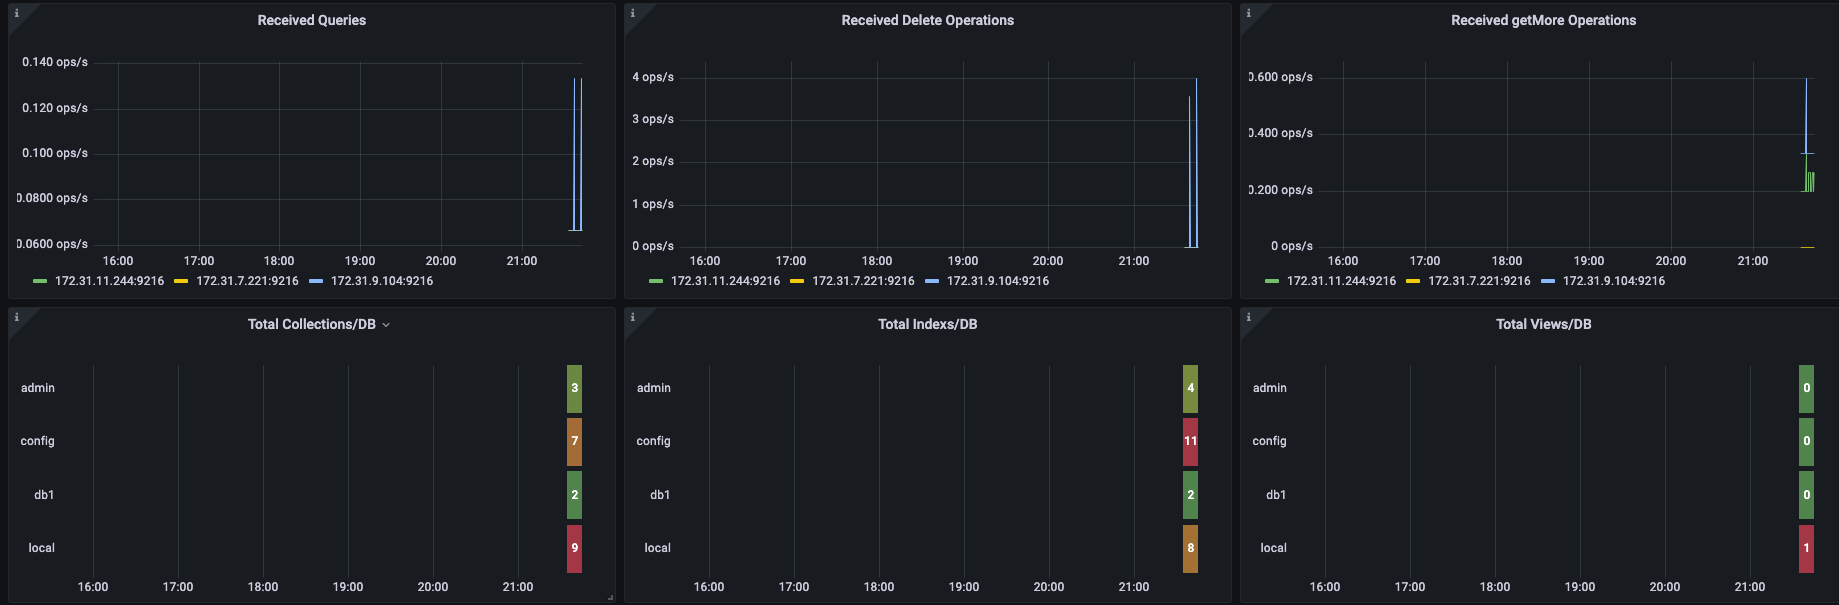
- Received Queries
- Received Delete Operations
- Received getMore Operations
- Total Collections per DB
- Total Index per DB
- Total Views per DB
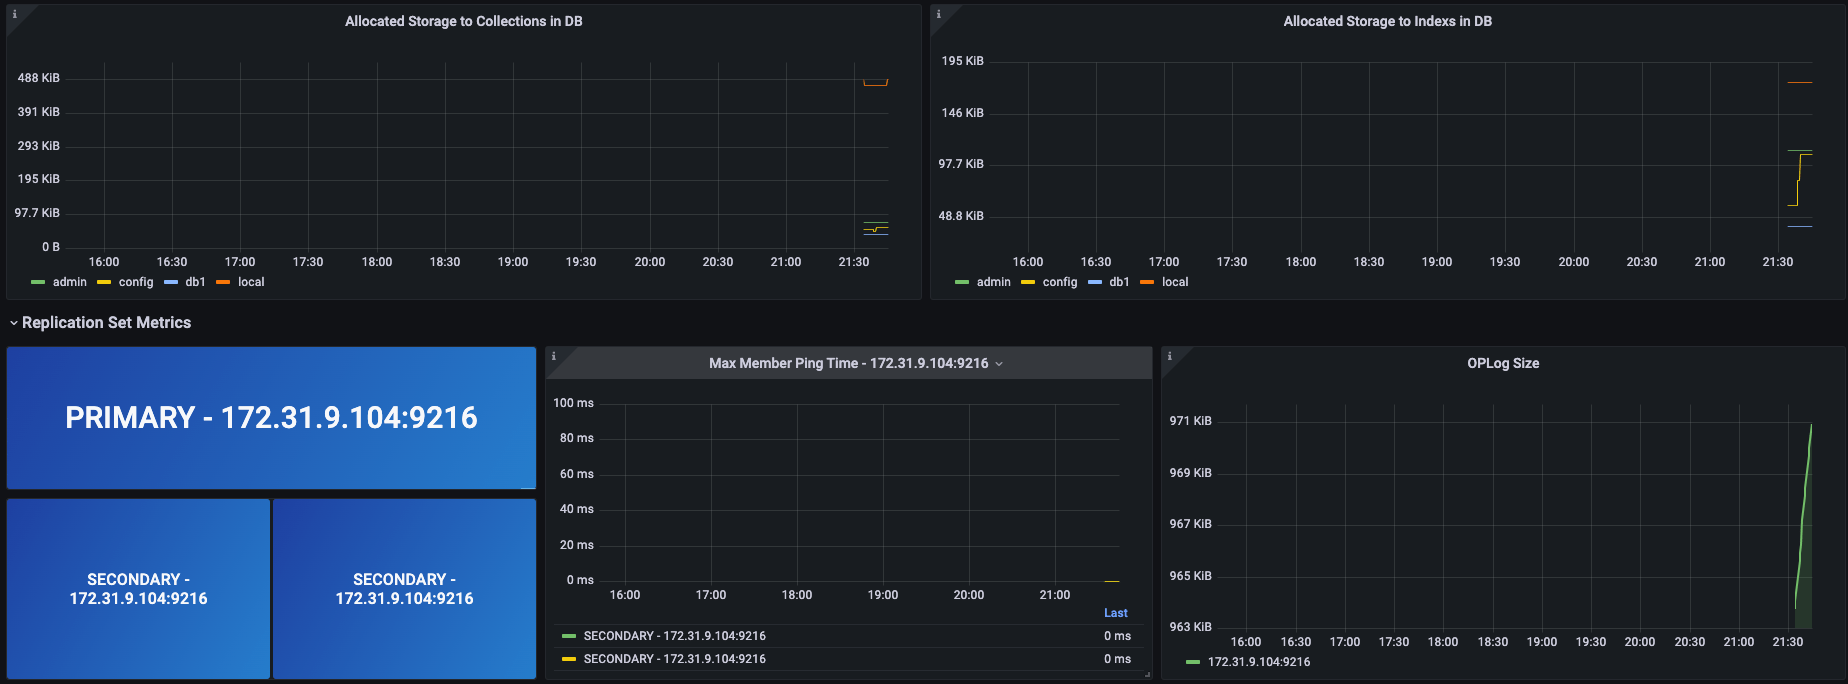
- Allocated Storage to Collections in DB
- Allocated Storage to indexes in DB
Replication Set Metrics
- Primary and Seconday Nodes
- Max Maaber Ping Time
- OpLog Size
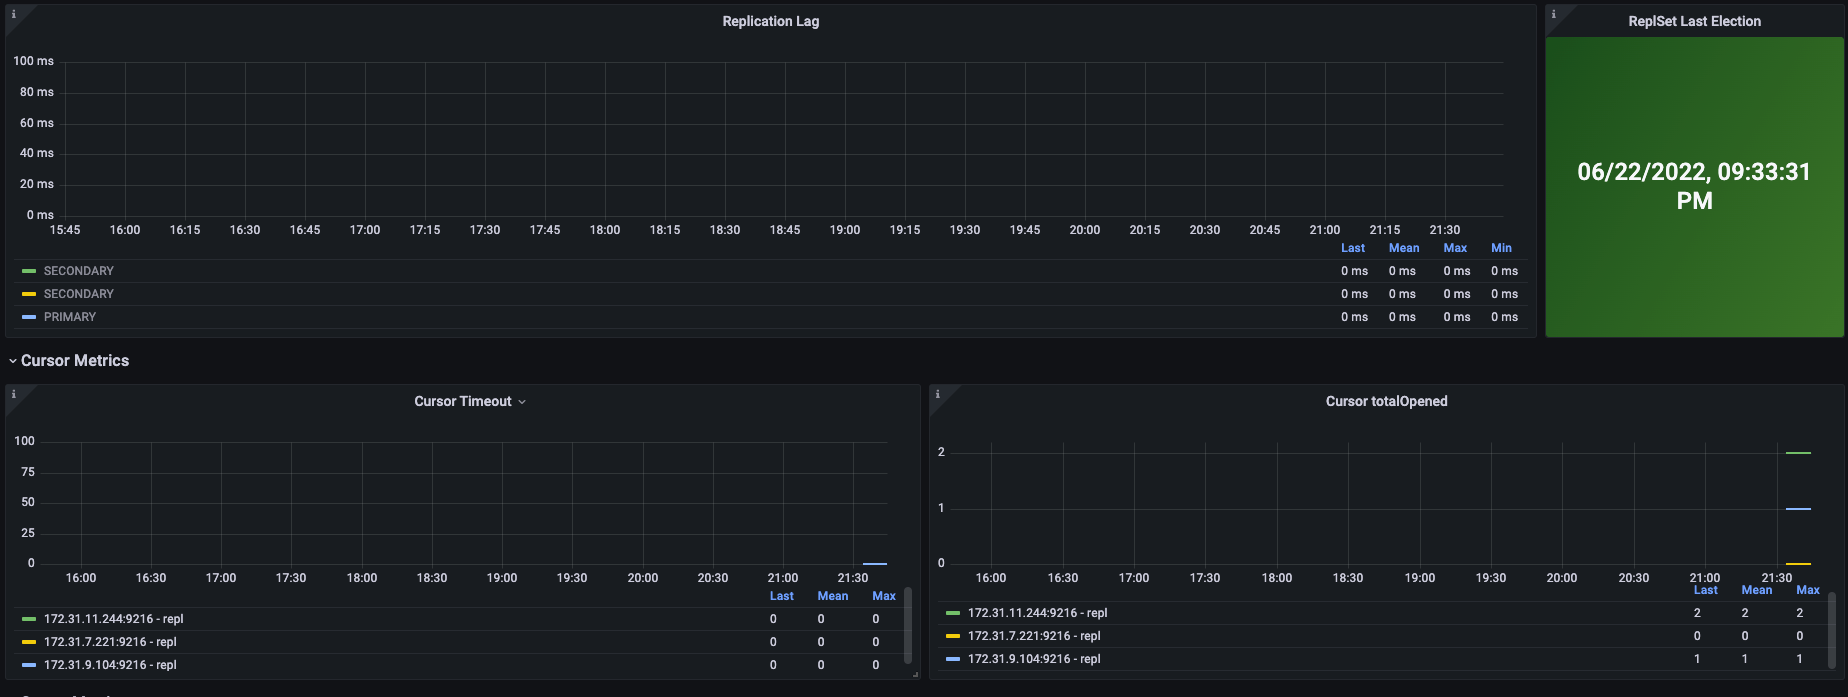
- Replication Lag
- Replication Last Election
Cursor Metrics
- Cursor Timeout
- Cursor TotalOpened
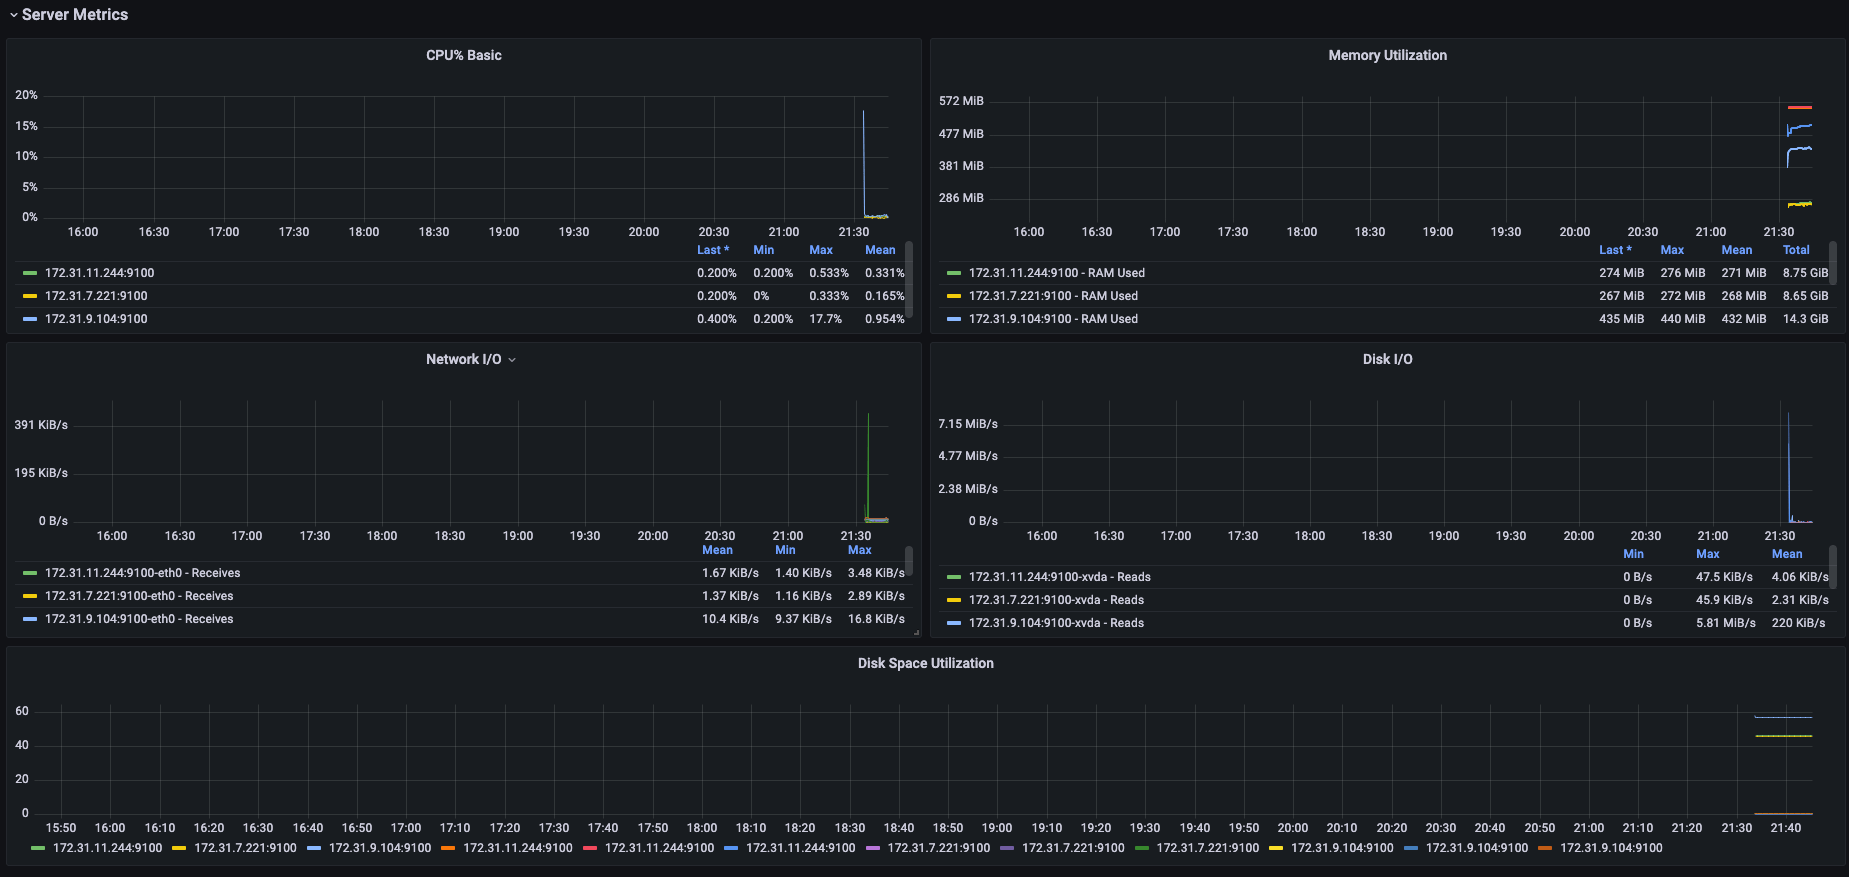
Server Metrics
- CPU%
- Memory Utilization
- Network I/O
- Disk I/O
- Disk Space Utilization
Service File to run Mongodb Exporter
[Unit]
Description=Mongodb Exporter
Wants=network-online.target
After=network-online.target
[Service]
User=root
Group=root
Type=simple
ExecStart=/usr/local/bin/mongodb_exporter –mongodb.uri=mongodb://mongodb_exporter:{{ mongodb_exporter_user_password }}@{{ mongodb_host }}:{{ mongodb_port }} –collect-all
[Install]
WantedBy=multi-user.target
Contributor Information
Data source config
Collector type:
Collector plugins:
Collector config:
Revisions
Upload an updated version of an exported dashboard.json file from Grafana
| Revision | Description | Created | |
|---|---|---|---|
| Download |