
Certificates
A Grafana Dashboard for visualizing the data collected by the x509_cert Telegraf plugin for InfluxDB.
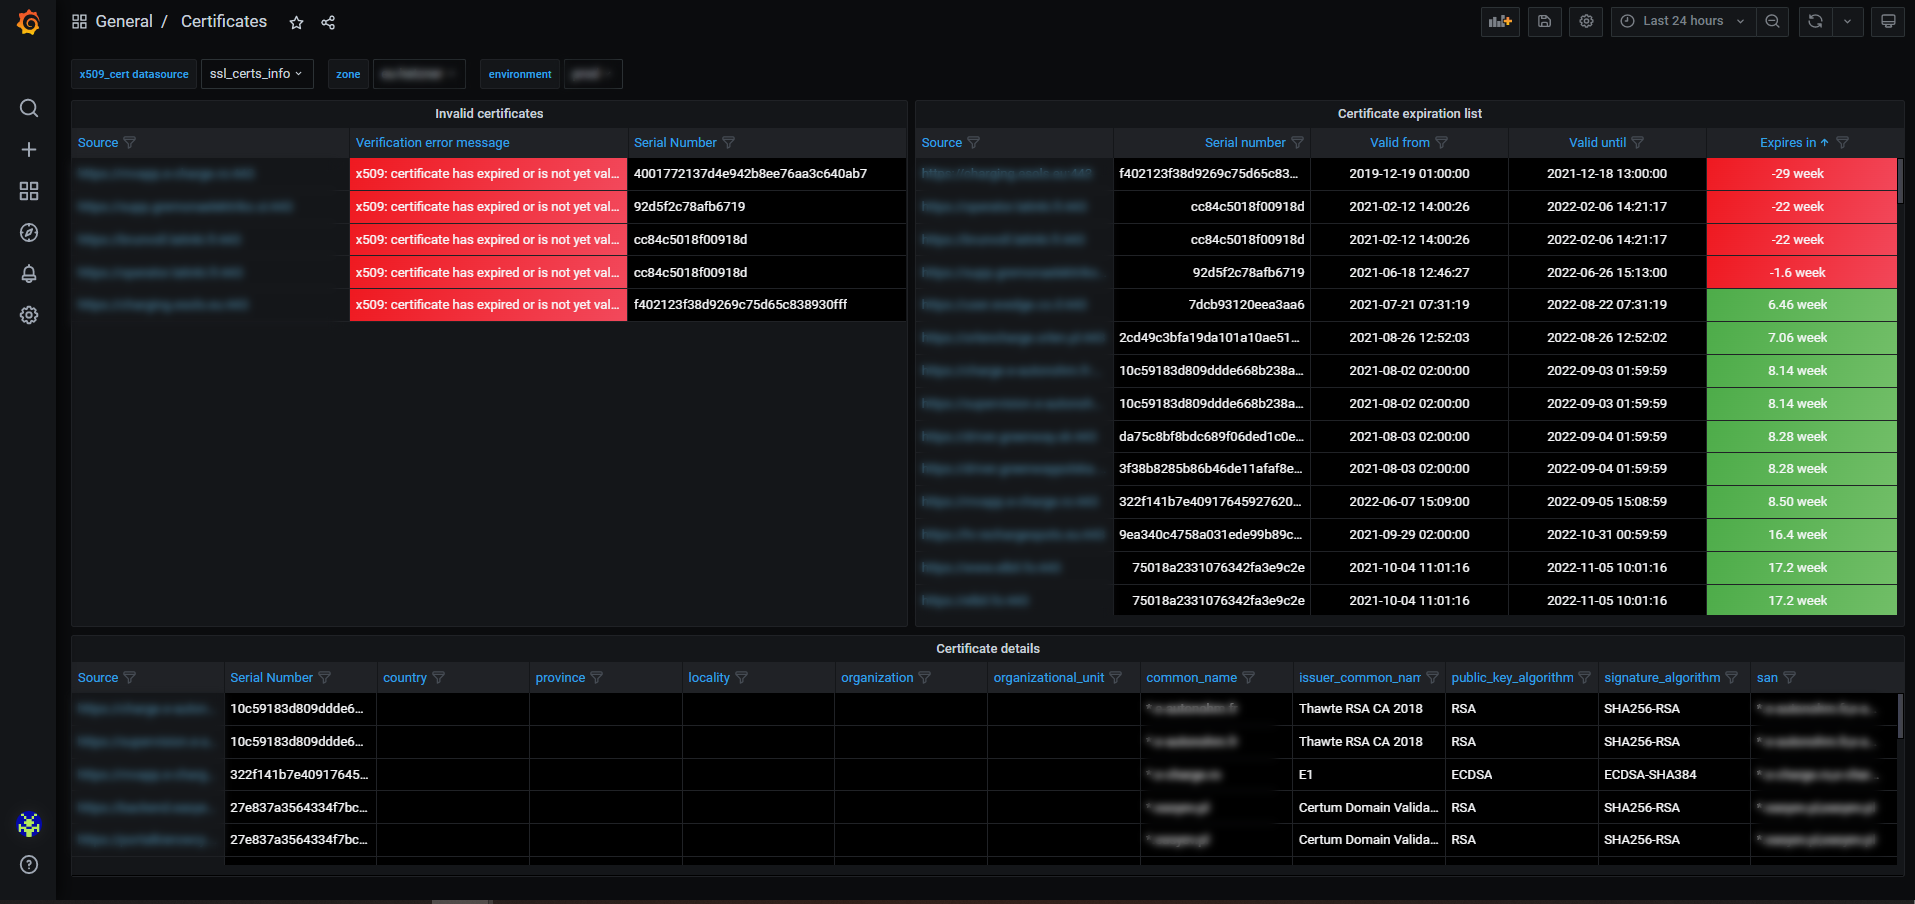
Certificates
A Grafana Dashboard for visualizing the data collected by the x509_cert Telegraf plugin for InfluxDB.
The main purpose of this dashboard is to notify you about a certificate expiry but it can also display other certificate errors. What is more, you can examine certificate chains by filtering your certificates by source.
You can contribute to the dashboard at: Glusk/x509_cert-grafana-dashboard
Data source config
Collector type:
Collector plugins:
Collector config:
Dashboard revisions
Upload an updated version of an exported dashboard.json file from Grafana
| Revision | Decscription | Created | |
|---|---|---|---|
| Download |
Sign up for Grafana Cloud

Get up and running in minutes with the Grafana Cloud free tier, which includes free forever 10k metrics, 50GB logs, 50GB traces, 500 VUh, and more.
Get this dashboard
Data source:
Dependencies: