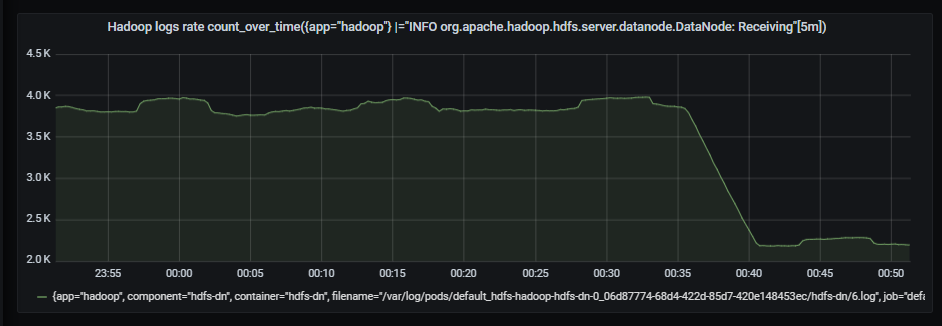
Checking Hadoop's liveness with logs rate
Since Hadoop don't have Prometheus metrics out of the box, we have invented the way how to check is it ok. We plot the counter of specific log tht is posted by Hadoop regularly and pick it from the Loki
Please add Loki as Prometheus as described there https://stackoverflow.com/questions/68794873/loki-that-is-set-up-as-prometheus-datasource-in-order-to-have-alerts-on-log-coun to use this dashboard
Data source config
Collector type:
Collector plugins:
Collector config:
Revisions
Upload an updated version of an exported dashboard.json file from Grafana
| Revision | Description | Created | |
|---|---|---|---|
| Download |
Grafana Loki (self-hosted)
Easily monitor Grafana Loki (self-hosted), a horizontally scalable, highly available, multi-tenant log aggregation system inspired by Prometheus, with Grafana Cloud's out-of-the-box monitoring solution.
Learn more