
Telegraf Windows Instances
InfluxDB dashboards for telegraf metrics
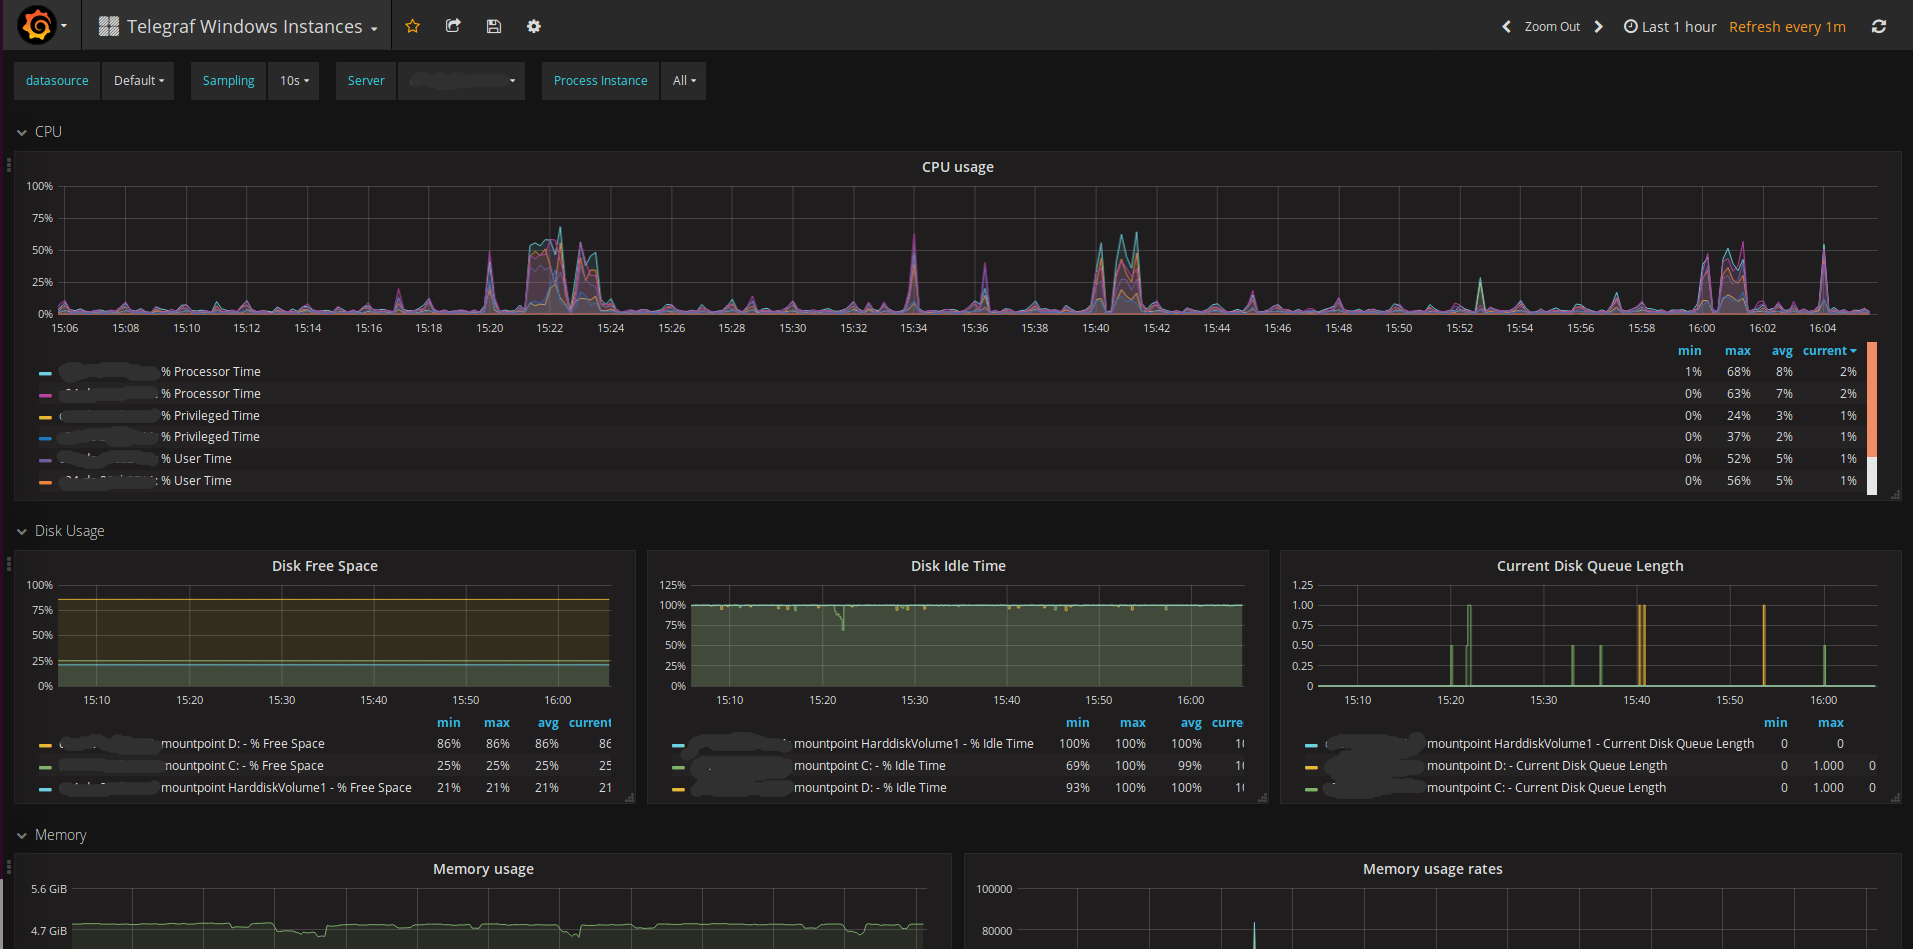
A Grafana dashboard for showing Windows Telegraf metrics, from an InfluxDB backend.
This requires the majority of inputs listed in the Generic
Queries and Process sections at the win_perf_counters
documentation
to be enabled on Telegraf clients.
Based on Telegraf templated host overview by lex.
Source also at github.com
Data source config
Collector type:
Collector plugins:
Collector config:
Dashboard revisions
Upload an updated version of an exported dashboard.json file from Grafana
| Revision | Decscription | Created | |
|---|---|---|---|
| Download |
Sign up for Grafana Cloud

Get up and running in minutes with the Grafana Cloud free tier, which includes free forever 10k metrics, 50GB logs, 50GB traces, 500 VUh, and more.
Get this dashboard
Data source:
Dependencies: