blackbox_exporter-http-Dashboards-english
blackbox_exporter HTTP monitoring panel
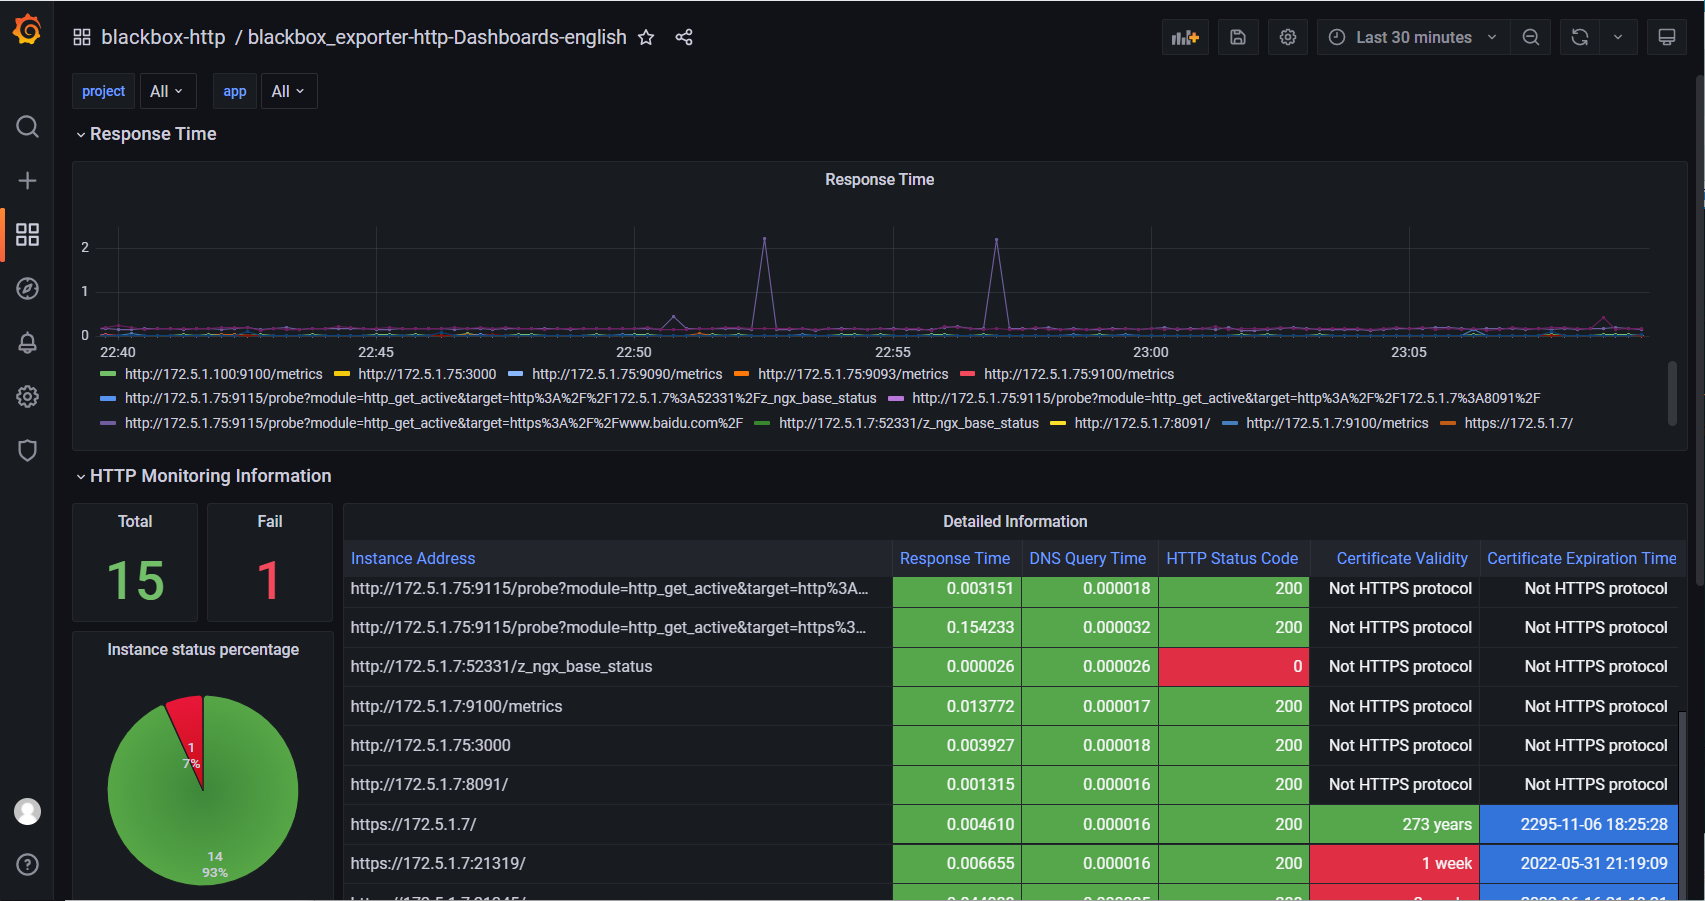
blackbox_exporter HTTP monitoring panel
Selector description
Project: the project tag corresponding to the target
App: app tag corresponding to target
v2 update summary
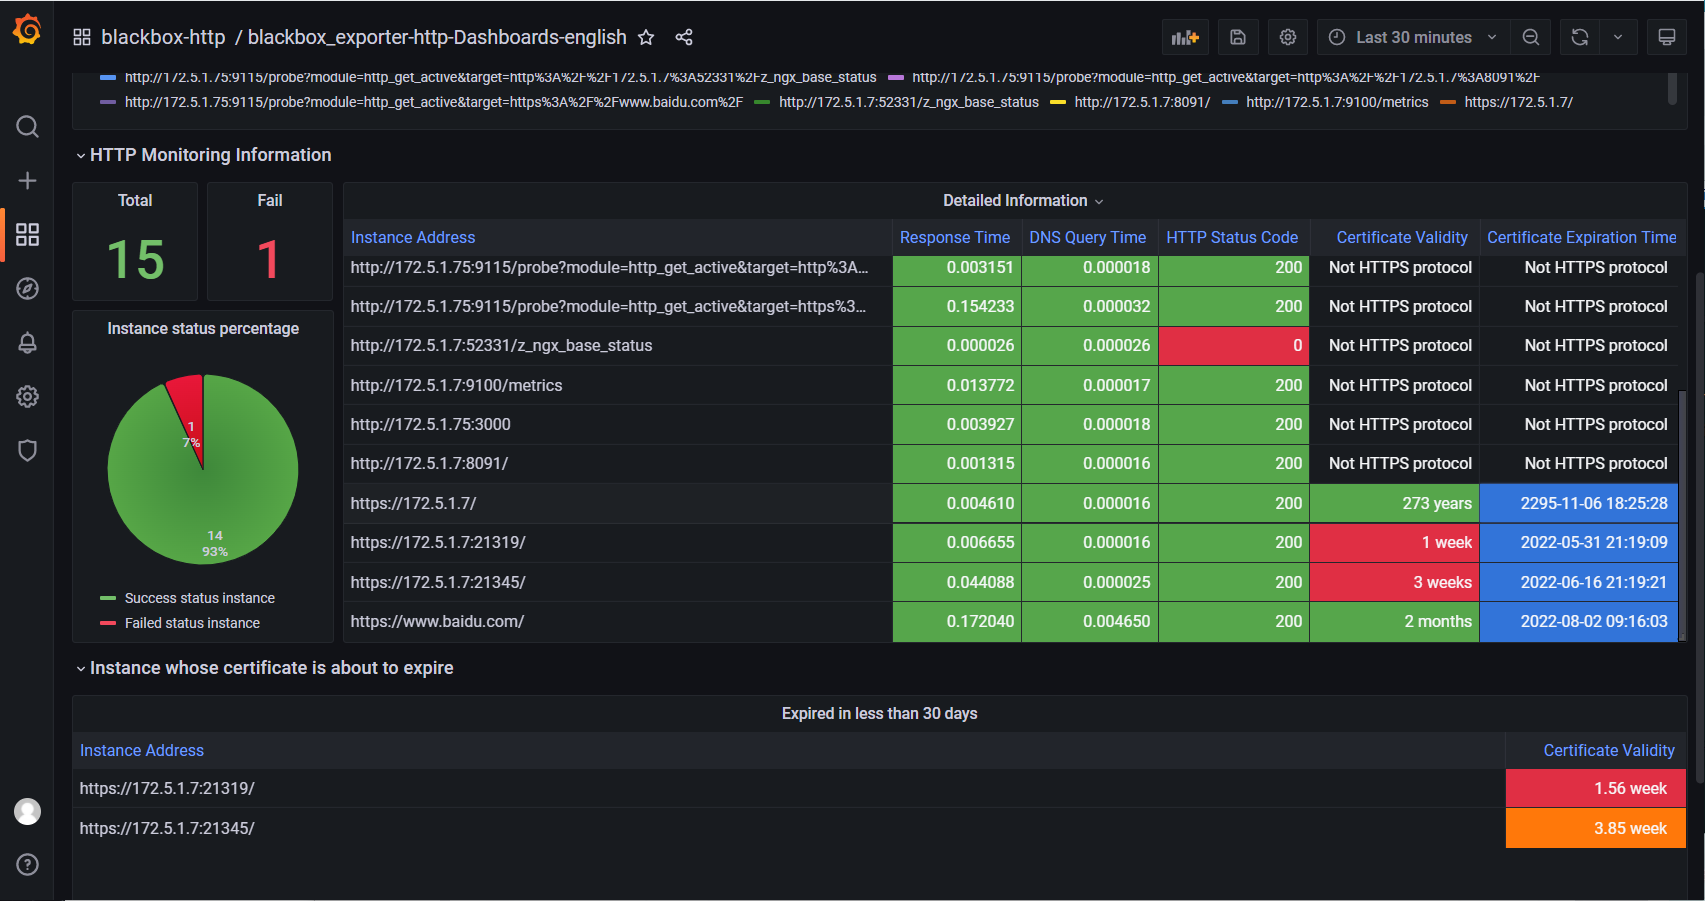
Examples with less than 30 days remaining for new certificates shall be listed separately
Add instance cell color matching of non HTTPS protocol
Fix the problem that fail displays no data when there are no failed hosts
Fix the problem that the proportion of failed instances and strength status is affected by the time range, and the data is inaccurate
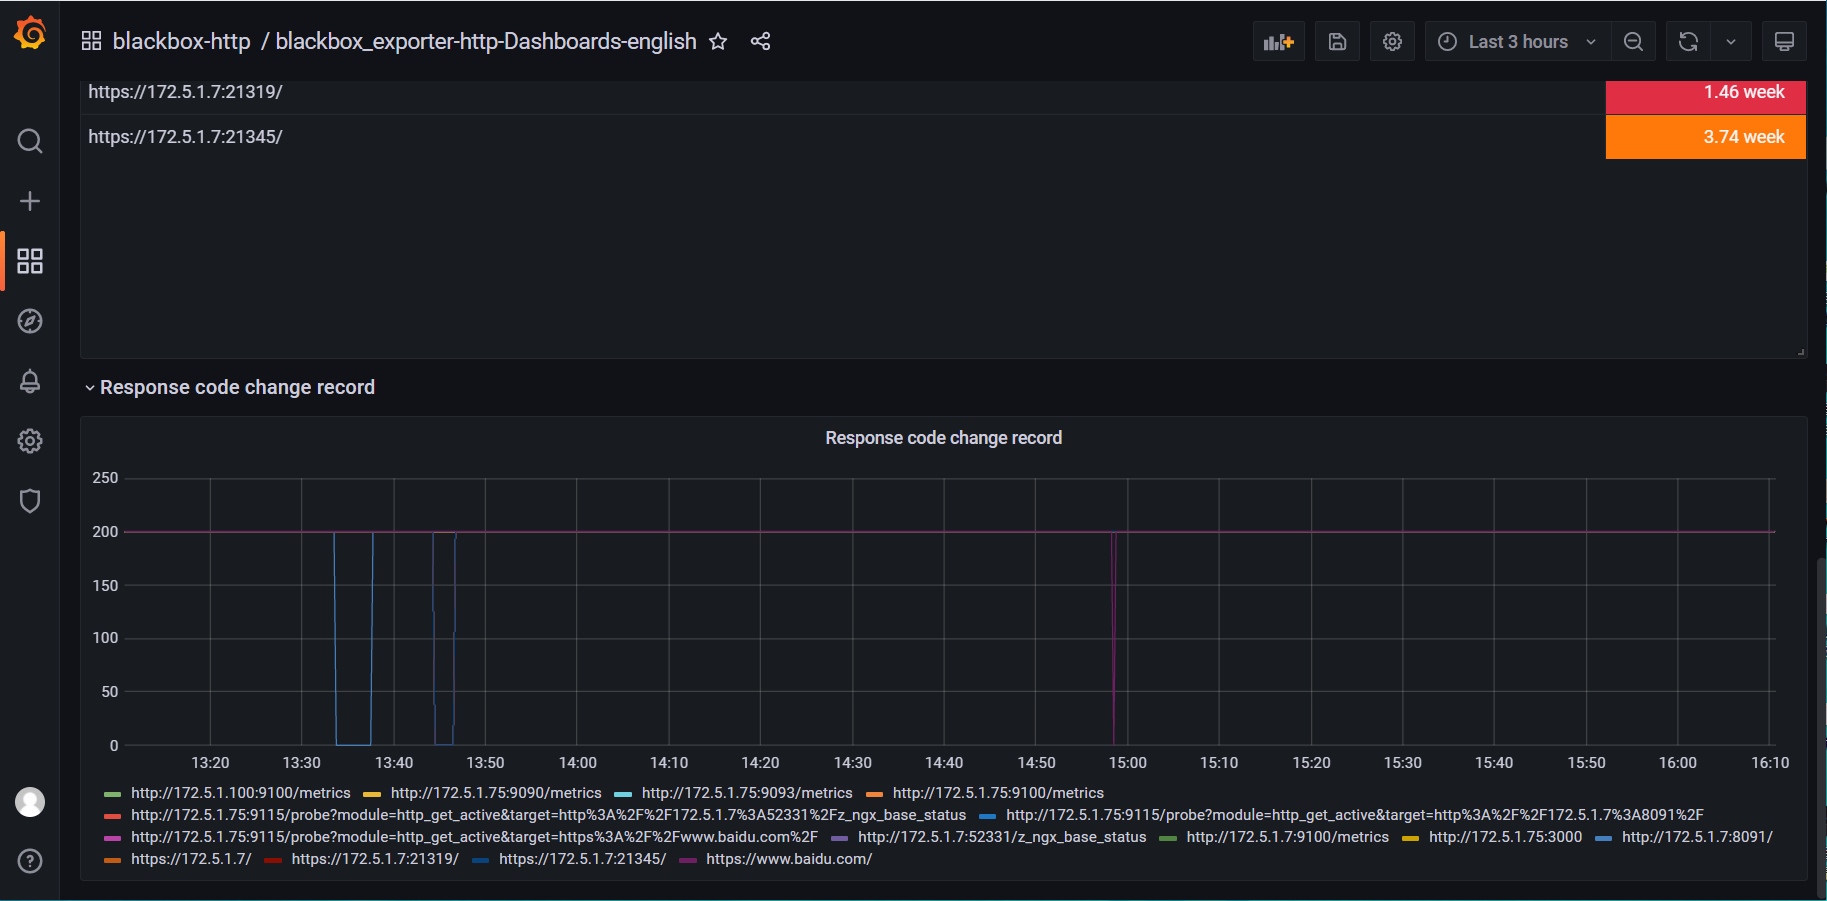
Add the response code change record chart to view the response code changes in the past time
对应中文面板 : https://grafana.com/grafana/dashboards/16292
ID : 16292
Data source config
Collector config:
Upload an updated version of an exported dashboard.json file from Grafana
| Revision | Description | Created | |
|---|---|---|---|
| Download |
Apache HTTP Server
Easily monitor Apache HTTP Server, an open source HTTP server for modern operating systems including UNIX and Windows, with Grafana Cloud's out-of-the-box monitoring solution.
Learn more