Rabbit Monitor
Simple server monitor
Rabbit Monitor
Rabbit Monitor is a simple program that fetches your computer data every 5 seconds (By default) and create /metrics API endpoint for other programs to collect data from it.
Required packages:
- quart
- psutil
- argparse
API Endpoints:
- /metrics (Support Prometheus)
Installation (Python and PIP required)
# Install Python modules
pip install quart psutil argparse
# Install Rabbit Monitor
pip install rabbitmonitor
# Start monitoring with
python3 -m rabbitmonitor
Daemonizing (using systemd)
Running Rabbit Monitor in the background is a simple task, just make sure that it runs without errors before doing this. Place the contents below in a file called rabbitmonitor.service in the /etc/systemd/system directory.
WARNING: Make sure to change the User to the one that have installed pip packages.
[Unit]
Description=Rabbit Monitor
After=network.target
[Service]
Type=simple
User=root
ExecStart=python3 -m rabbitmonitor
TimeoutStartSec=0
TimeoutStopSec=2
RemainAfterExit=yes
[Install]
WantedBy=multi-user.target
Then, run the commands below to reload systemd and start Rabbit Monitor.
systemctl enable --now rabbitmonitor
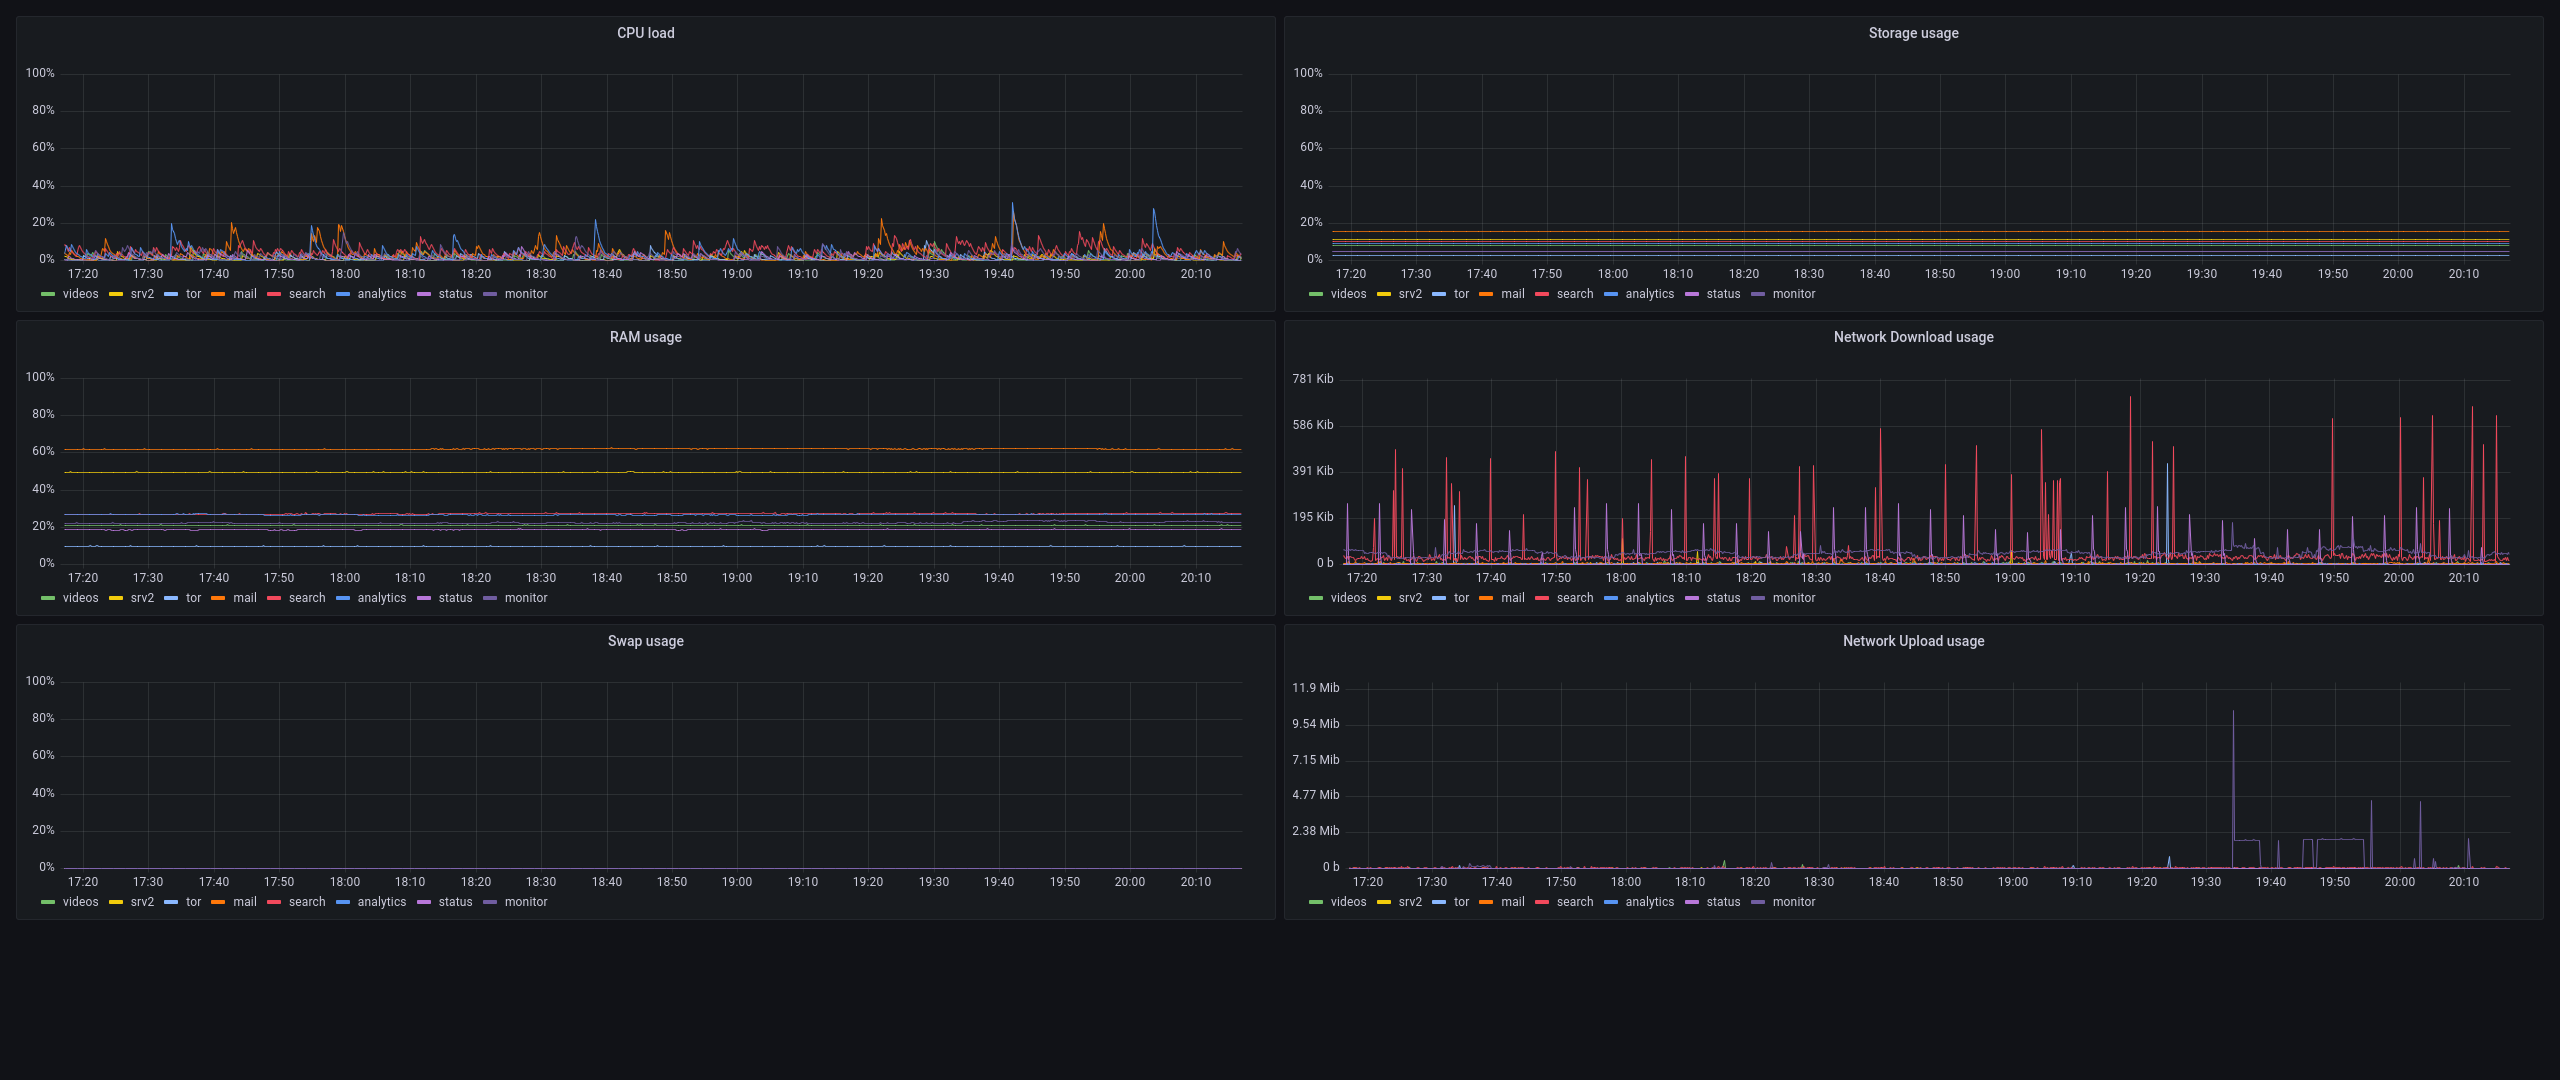
Grafana Dashboard
Rabbit Monitor has a pre-made Grafana dashboard that looks like this:
 It can be installed from official Grafana website: https://grafana.com/grafana/dashboards/16275
Data source config
Collector config:
Upload an updated version of an exported dashboard.json file from Grafana
| Revision | Description | Created | |
|---|---|---|---|
| Download |