
1 - APM Overview
APM Overview across all services.
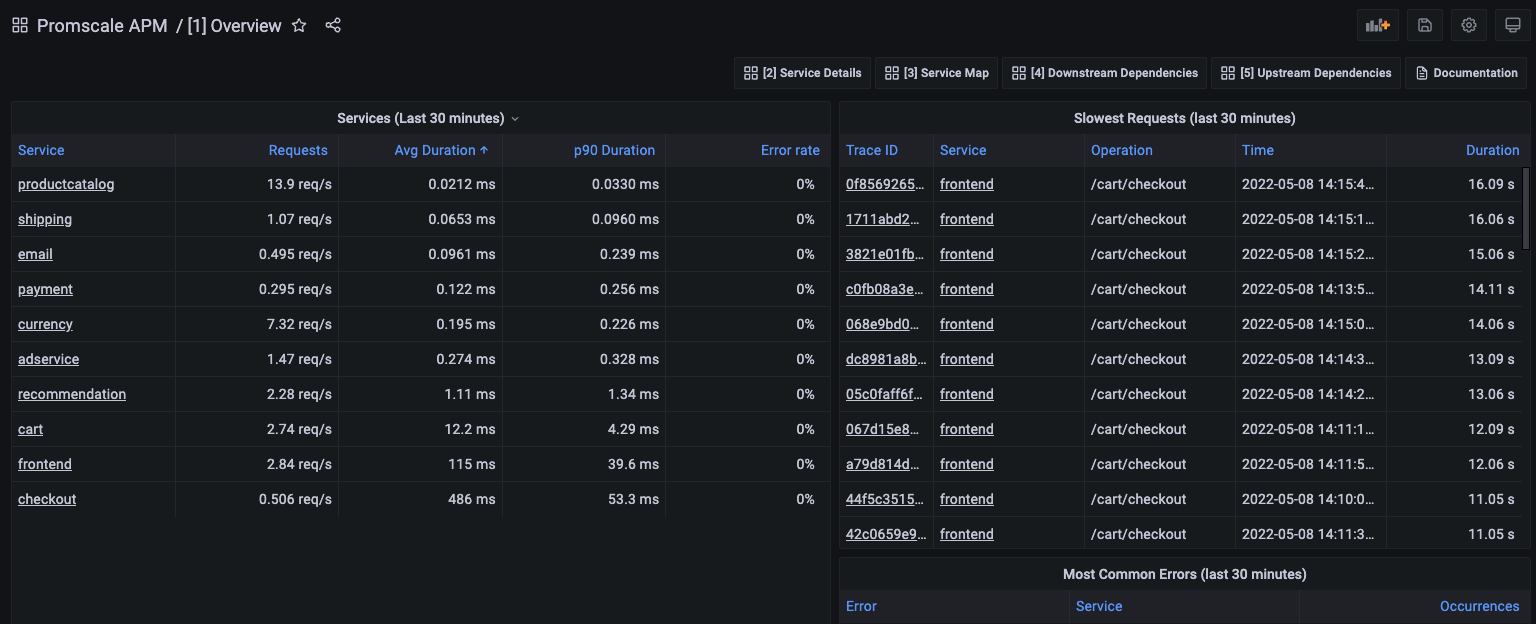
APM Overview dashboard offered by Promscale on top of traces by leveraging SQL and TimescaleDB capabilities.
This dashboard contains from the last 30 mins :
- Services describing service level metrics i.e. Requests rate, Average duration, p90 duration, and Error rate.
- Slowest Requests describing Trace ID, Service, Operation. Timestamp and Duration.
- Most Common Errors describing Error, Service, and Occurrences.
Data source config
Collector type:
Collector plugins:
Collector config:
Dashboard revisions
Upload an updated version of an exported dashboard.json file from Grafana
| Revision | Decscription | Created | |
|---|---|---|---|
| Download |
Sign up for Grafana Cloud

Get up and running in minutes with the Grafana Cloud free tier, which includes free forever 10k metrics, 50GB logs, 50GB traces, 500 VUh, and more.
Get this dashboard
Data source:
Dependencies: