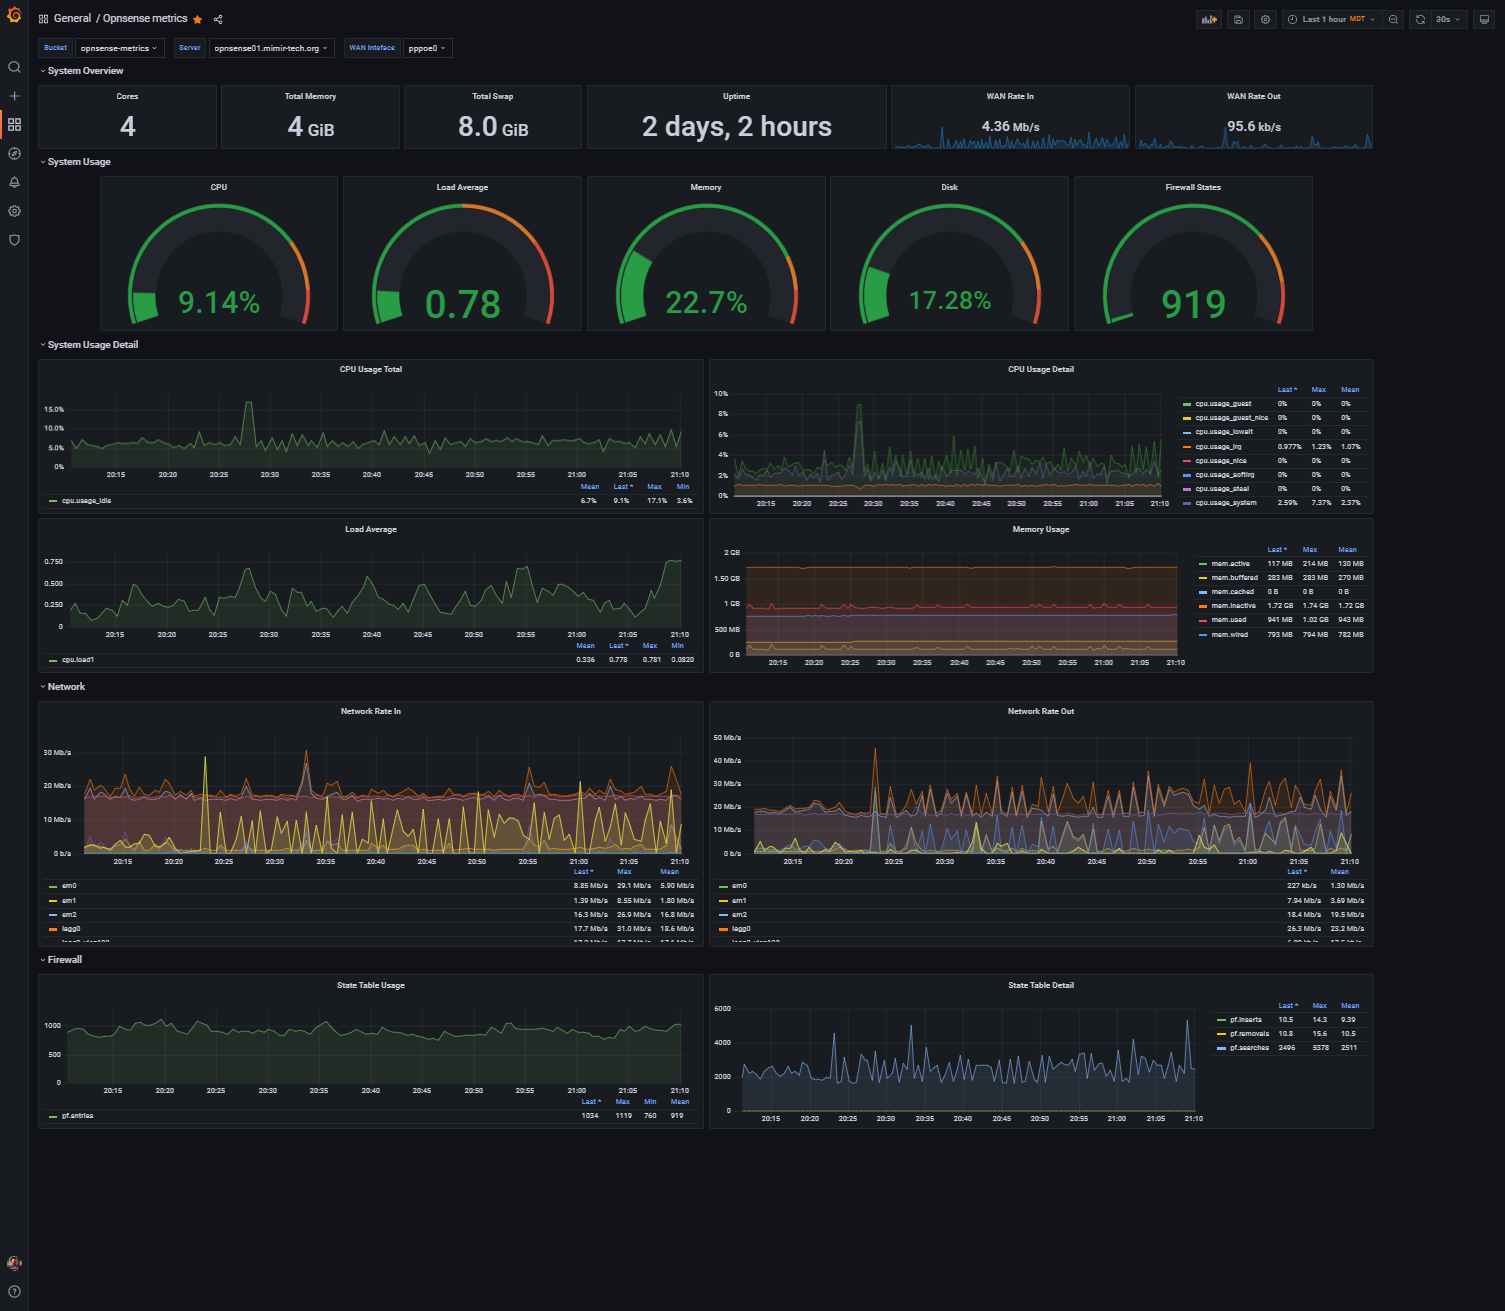
Opnsense Metrics (FluxQL)
opnsense metrics from InfluxDB/FluxQL using Telegraf. Supports multiple Opnsense hosts/interfaces and InfluxDB buckets via dynamic variables.
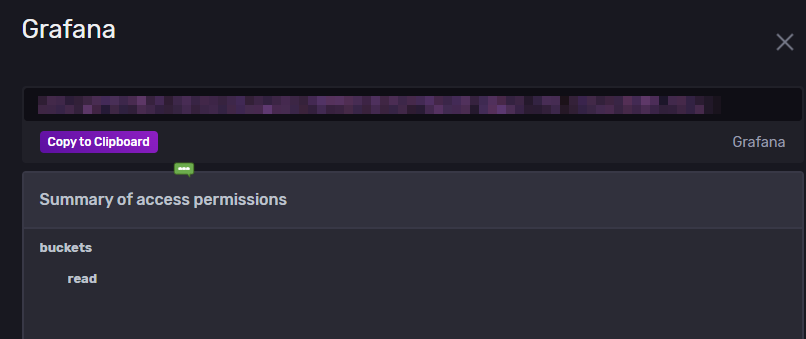
When setting up Grafana with InfluxDB 2.x/1.8+ for FluxQL, it's important to note, that the API token won't work if you limit it to a single bucket. You need to generate a key that grants access to all buckets; at least it wouldn't work for me until I did this. Limiting Grafana to read only permissions is fine, and you should, but it has to be able to list list all the buckets.
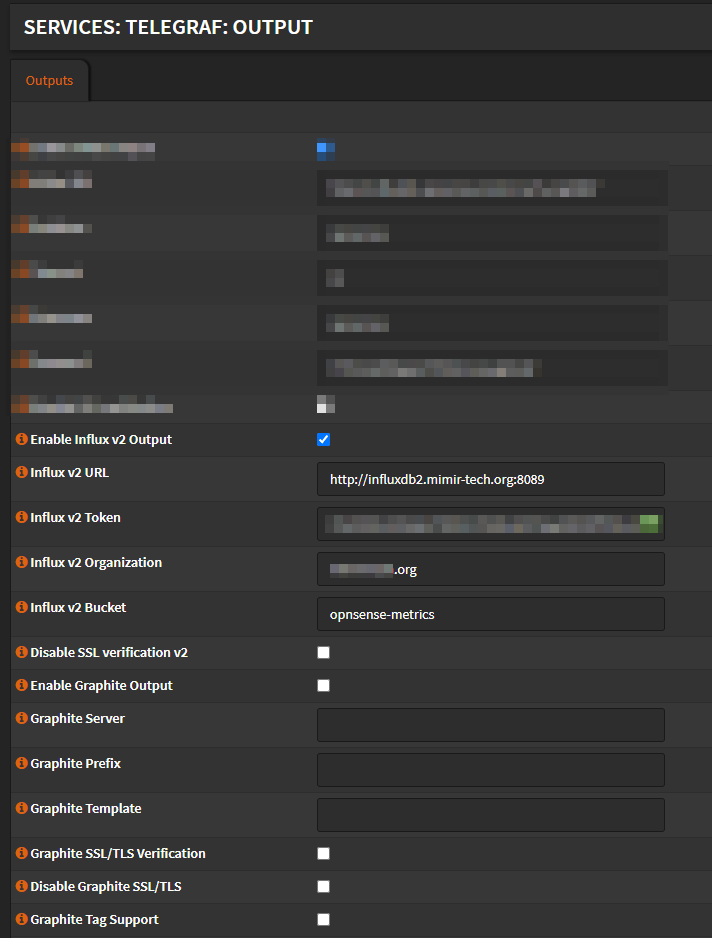
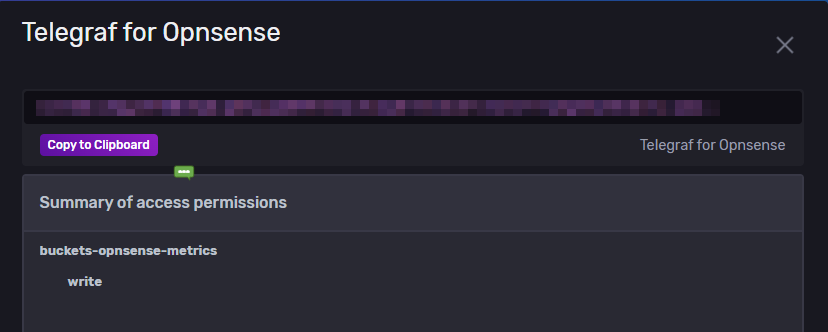
For Telegraf, you can generate an API token that is specifically limit it to write access and a single bucket.
Data source config
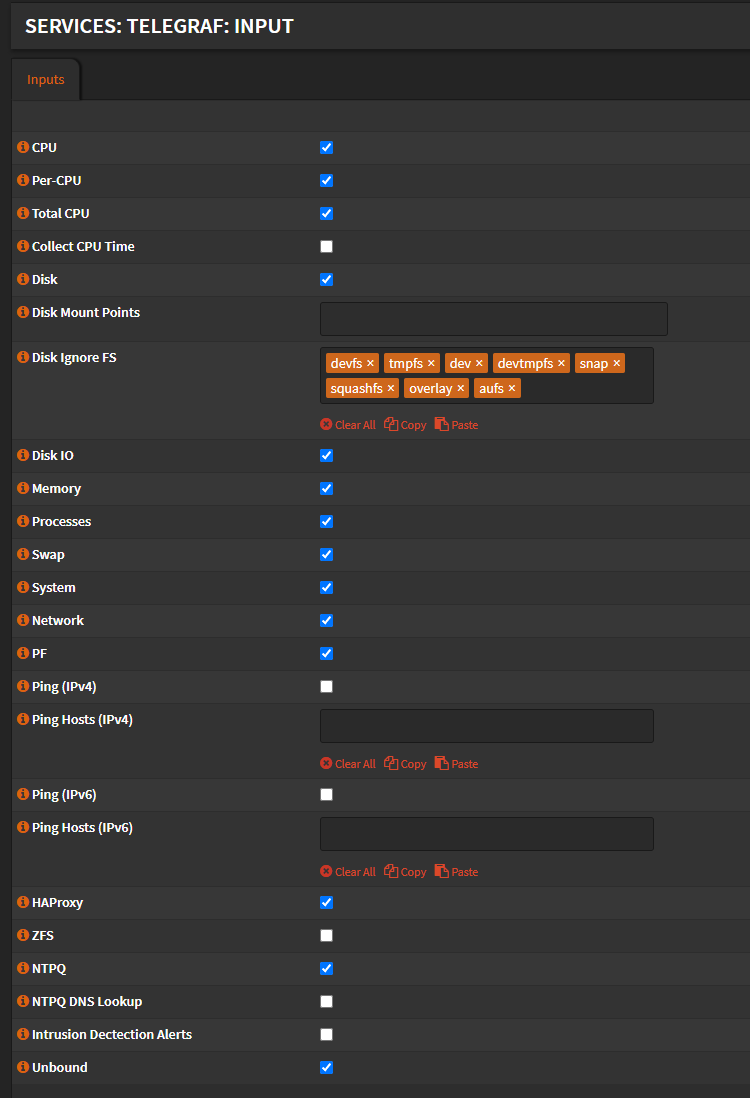
Collector type:
Collector plugins:
Collector config:
Revisions
Upload an updated version of an exported dashboard.json file from Grafana
| Revision | Description | Created | |
|---|---|---|---|
| Download |