
METRICS BASIC FOR WINDOWS AND GRAPHIC CARD
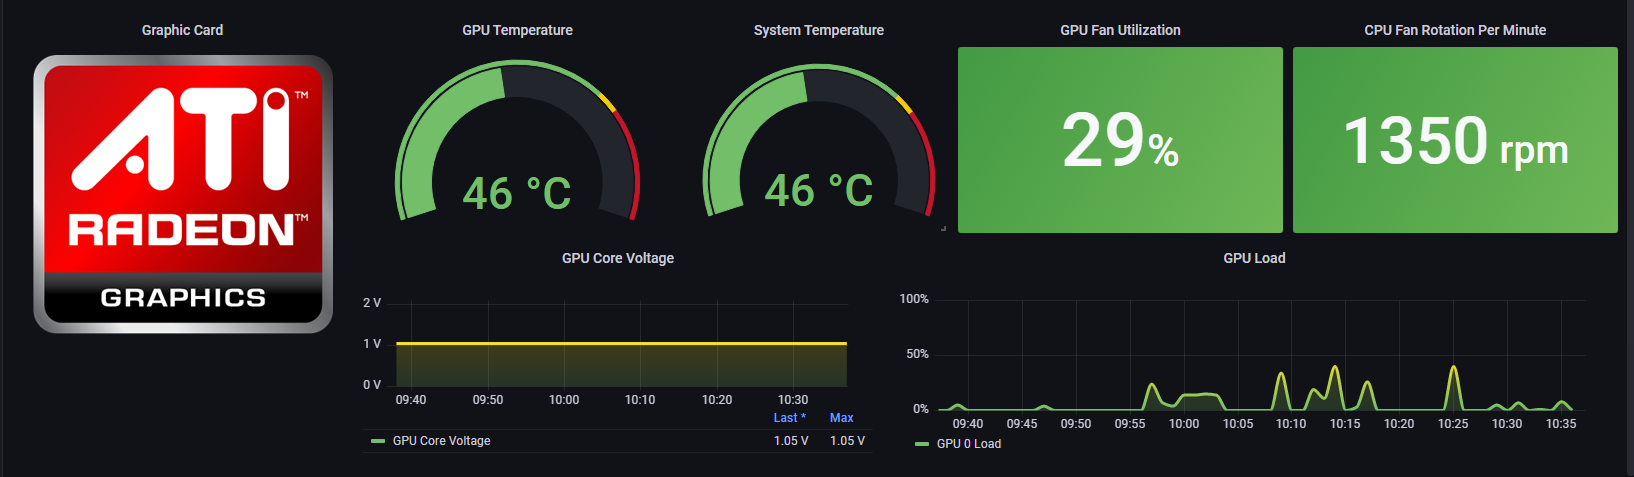
This dashboard was developed using metrics obtained from Zabbix with Open Hardware Monitor and the monitors were created by WMI queries that Open Hardware Monitor creates on Windows. I used some information from this model as a base: https://github.com/derpaherk/Zabbix-GPU-Monitoring/tree/master/AMD%20GPU In this dashboard example the AMD HD 6850 graphics card model used.
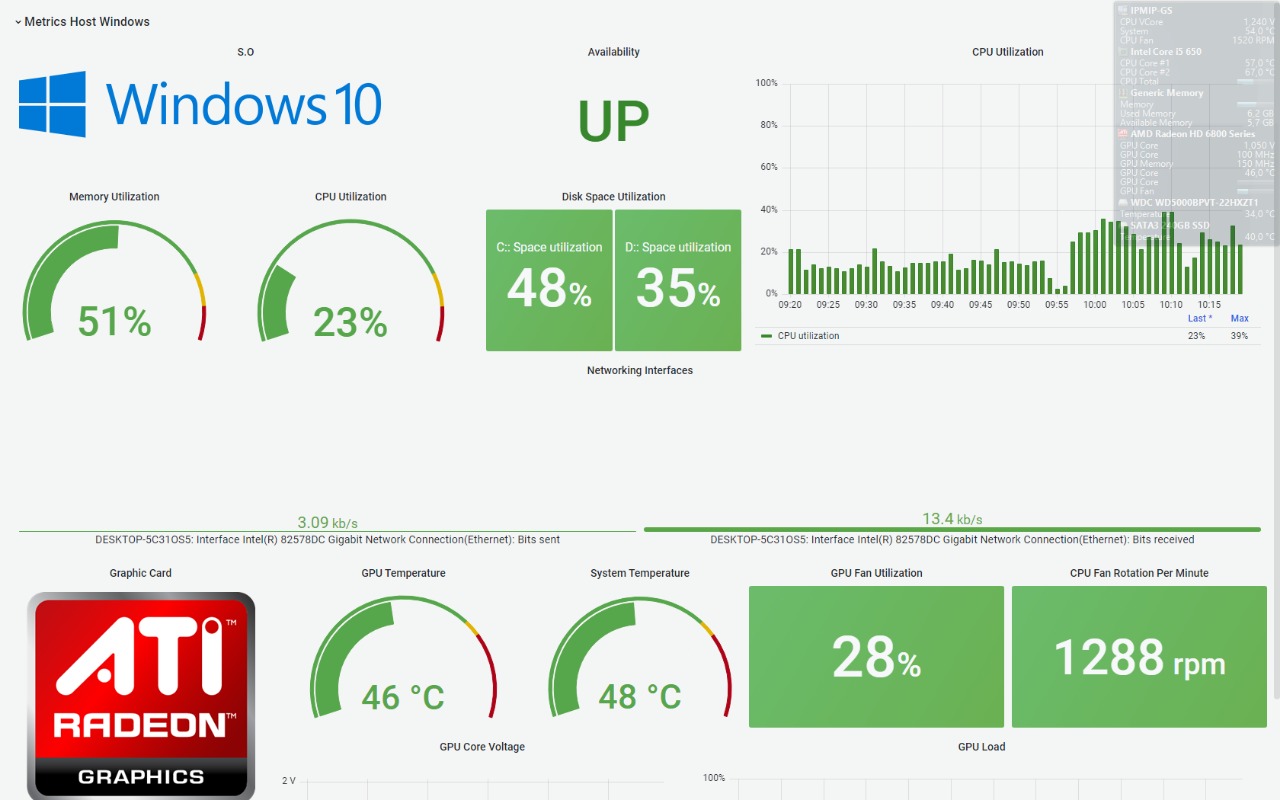
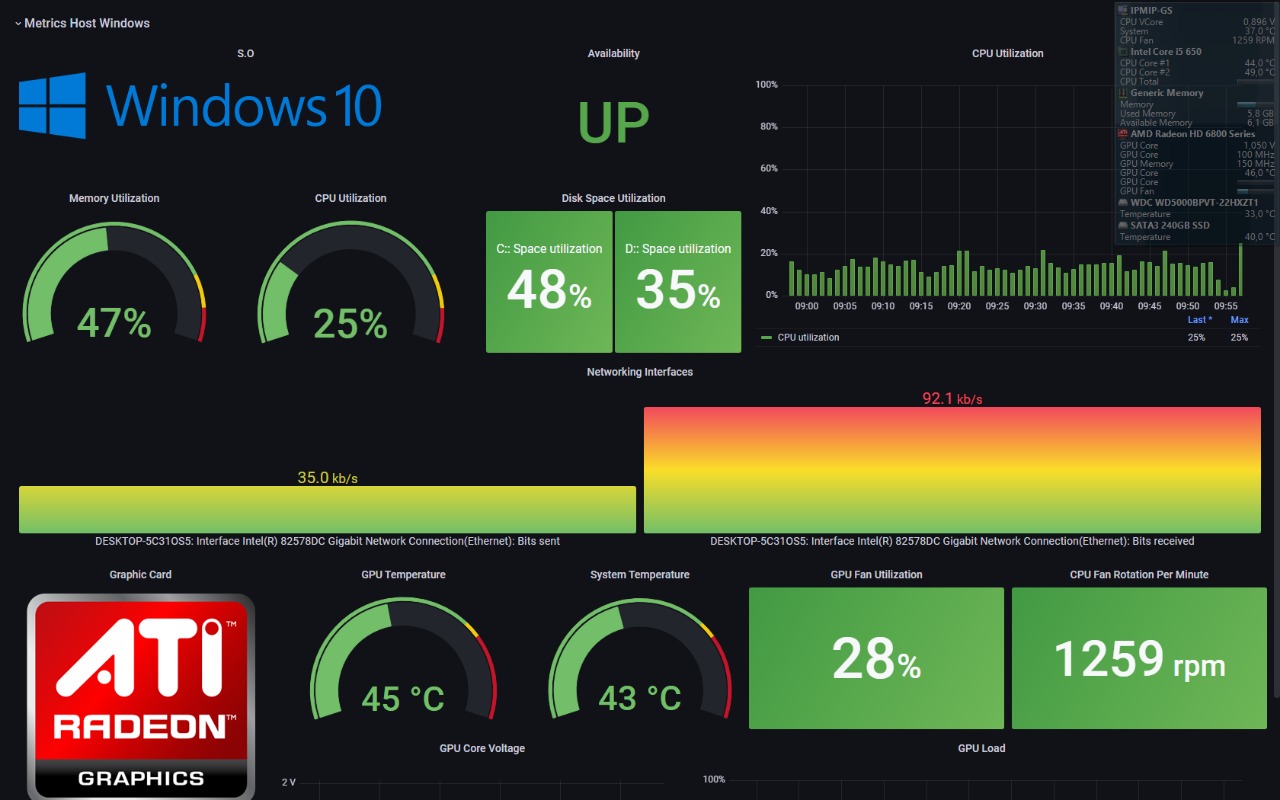
Attention in the graphics was used the replace alias function to not display the Host name in the graphics for a better visualization !
Data source config
Collector type:
Collector plugins:
Collector config:
Dashboard revisions
Upload an updated version of an exported dashboard.json file from Grafana
| Revision | Decscription | Created | |
|---|---|---|---|
| Download |
Sign up for Grafana Cloud

Get up and running in minutes with the Grafana Cloud free tier, which includes free forever 10k metrics, 50GB logs, 50GB traces, 500 VUh, and more.
Get this dashboard
Data source:
Dependencies: