XDR View (Aerospike 5.0+ only)
XDR Dashboard displays key metrics like lag, bytes-shipped related to the data backup and transfer status between each data-center and namespaces configuted
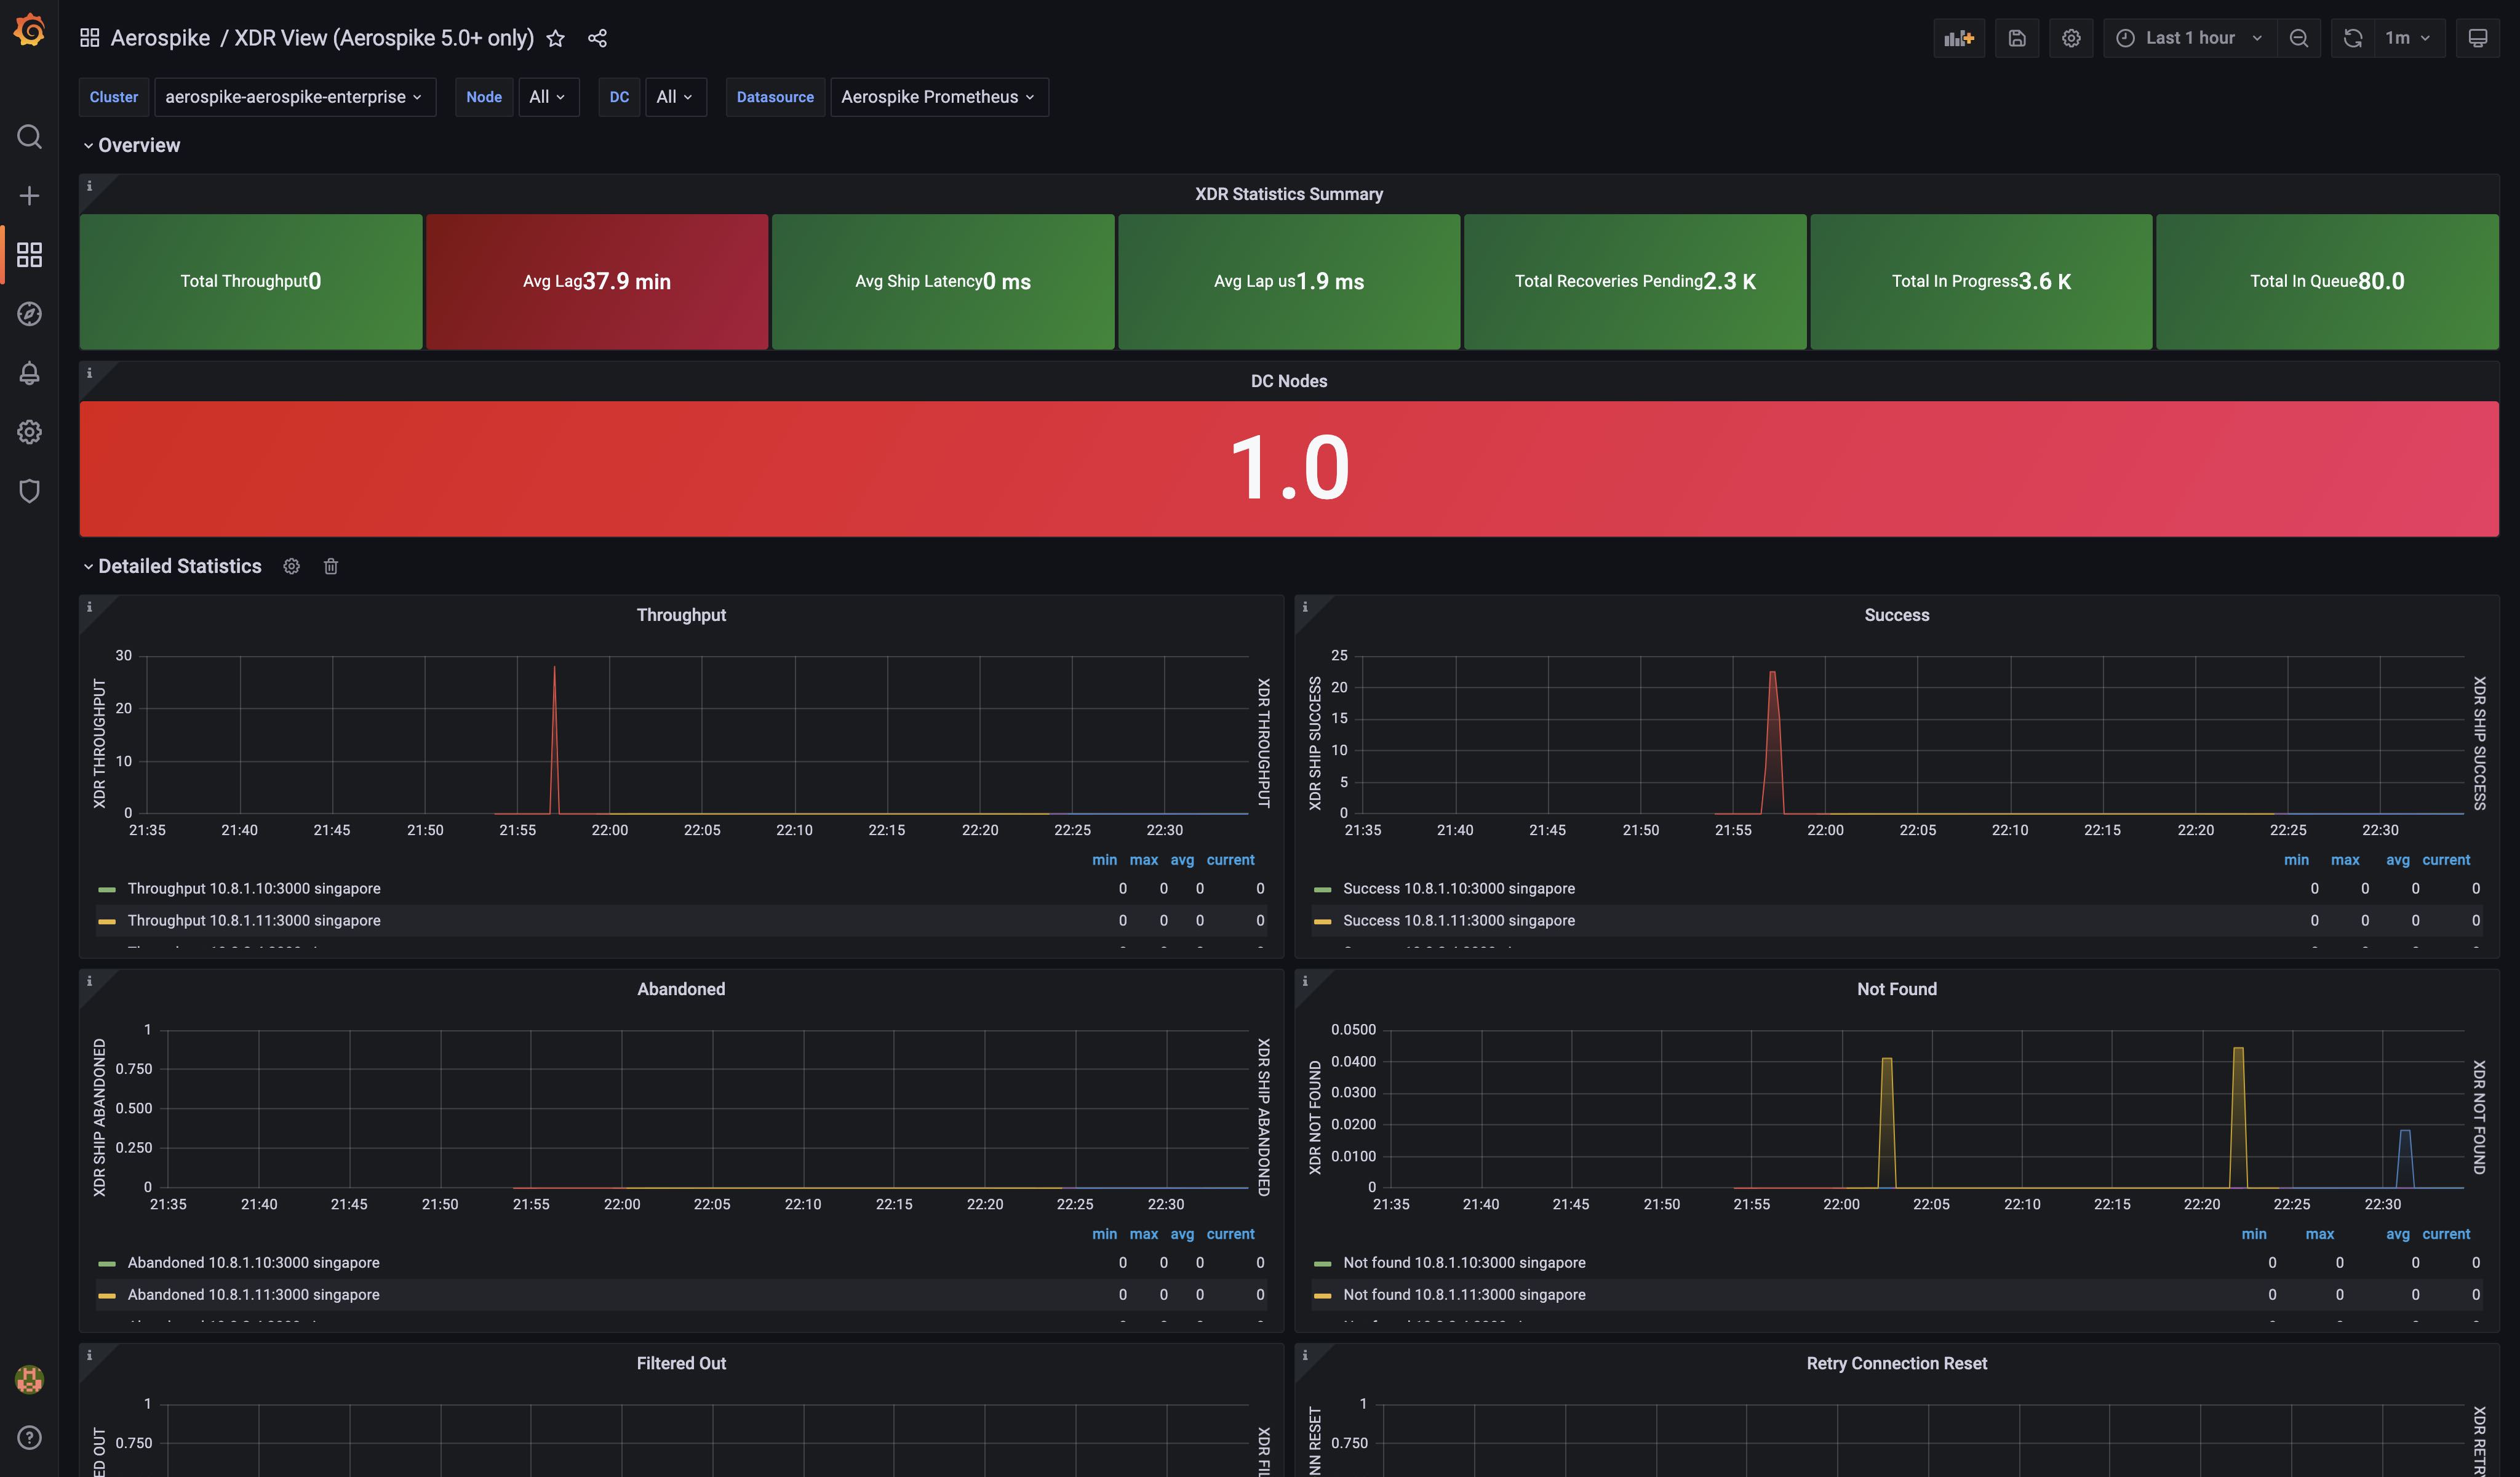
XDR View dashboard for Aerospike Monitoring Stack
Aerospike's Monitoring Stack extracts operational metrics from Aerospike database clusters for visualization and analysis in Prometheus and Grafana.
See Aerospike Monitoring Stack Architecture and Aerospike Monitoring Stack Installation for more details
Data source config
Collector type:
Collector plugins:
Collector config:
Revisions
Upload an updated version of an exported dashboard.json file from Grafana
| Revision | Description | Created | |
|---|---|---|---|
| Download |