Flask Monitoring
Flask Monitoring with StatsD
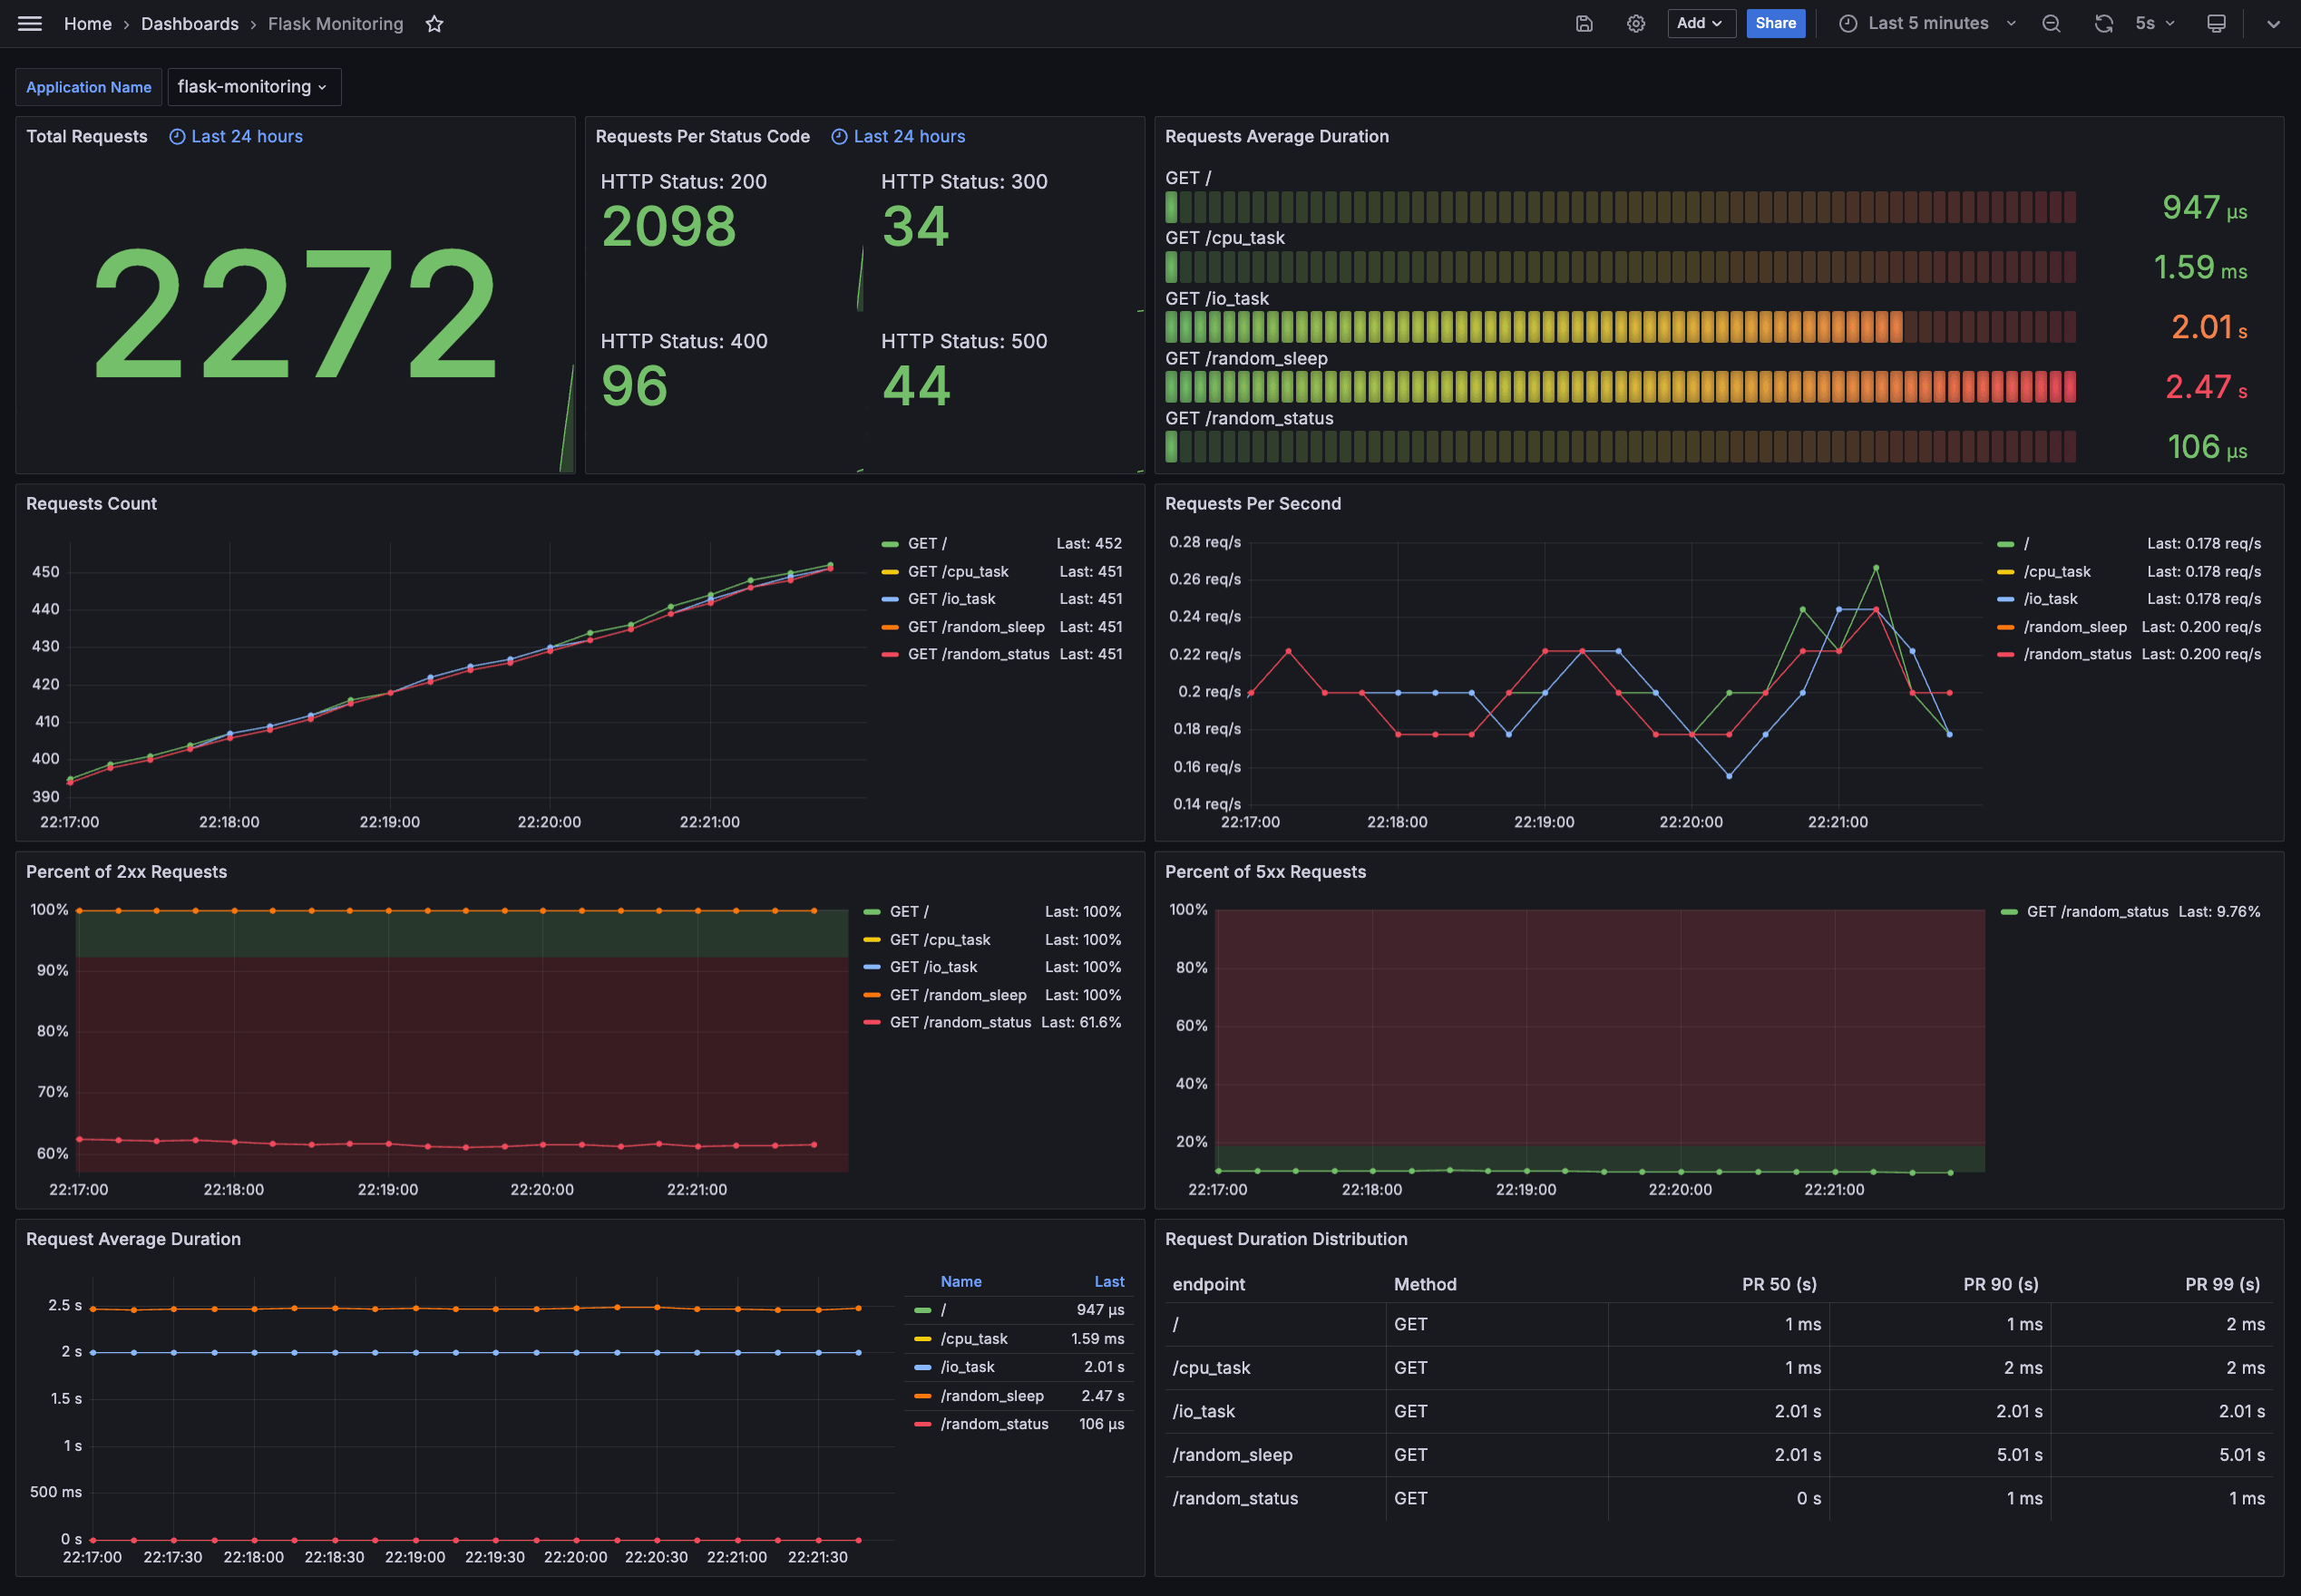
Monitor Flask application through custom StatsD metrics with Prometheus and Grafana.
- Flask app sends StatsD format metrics by UDP to statsd_exporter
- Prometheus scrapes prometheus format metrics from statsd_exporter
- Grafana queries data from Prometheus
Check more details on Flask Monitoring.
Data source config
Collector type:
Collector plugins:
Collector config:
Revisions
Upload an updated version of an exported dashboard.json file from Grafana
| Revision | Description | Created | |
|---|---|---|---|
| Download |