AWS CNI Metrics
USE (Utilization Saturation Errors) metrics dashboards for troubleshooting pod IP management in EKS
The AWS VPC CNI, found on EKS, exposes metrics that can be collected in Prometheus. This is not the case by default, AWS favoring CloudWatch, so you'll have to add a podMonitor matching the aws-node daemonset:
apiVersion: monitoring.coreos.com/v1
kind: PodMonitor
metadata:
  name: aws-cni-metrics
  namespace: kube-system
spec:
  jobLabel: k8s-app
  namespaceSelector:
    matchNames:
    - kube-system
  podMetricsEndpoints:
  - interval: 30s
    path: /metrics
    port: metrics
  selector:
    matchLabels:
      k8s-app: aws-node
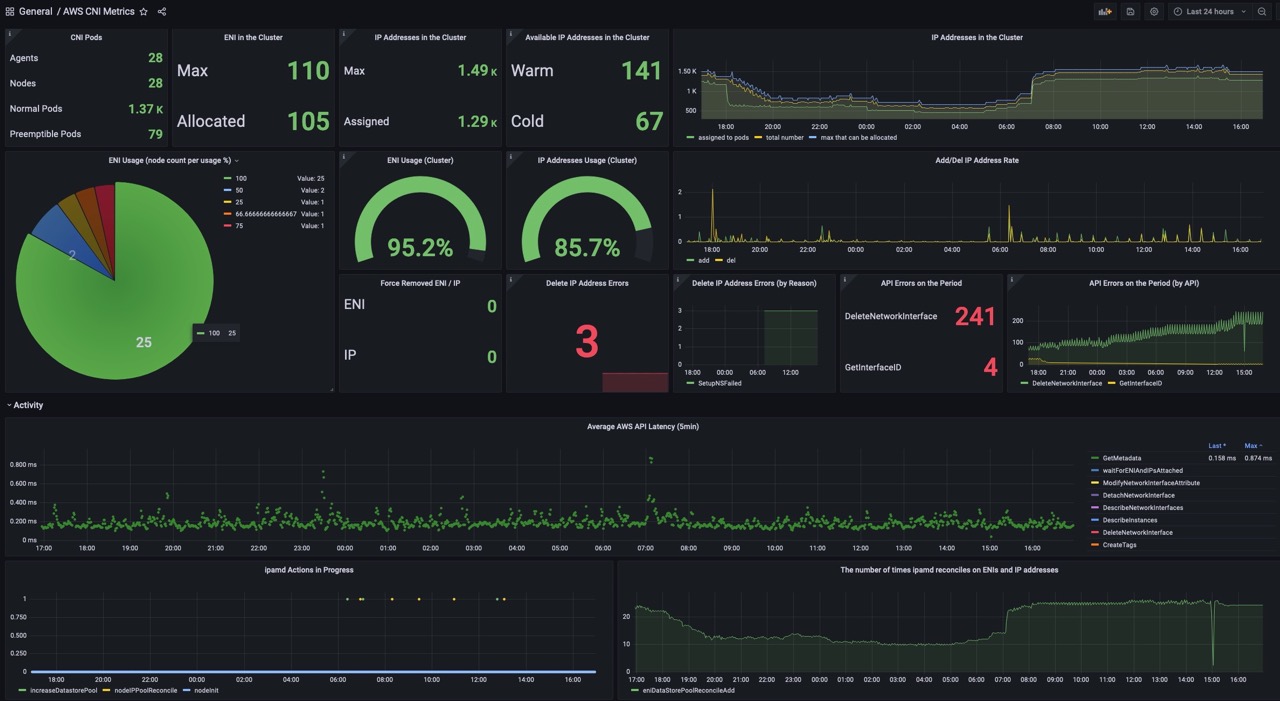
The dashboard displays
- the ENI / IP usage (saturation of IPs in the allocated ENIs, saturation of ENI on the nodes),
- the latency related to the different AWS API calls
- the errors on the API calls and the IPAM operations
Data source config
Collector type:
Collector plugins:
Collector config:
Revisions
Upload an updated version of an exported dashboard.json file from Grafana
| Revision | Description | Created | |
|---|---|---|---|
| Download |
AWS
Easily visualize and alert on more than 60 Amazon Web Services (AWS) resources using the fully managed Grafana Cloud platform.
Learn more