
Mimir / Reads
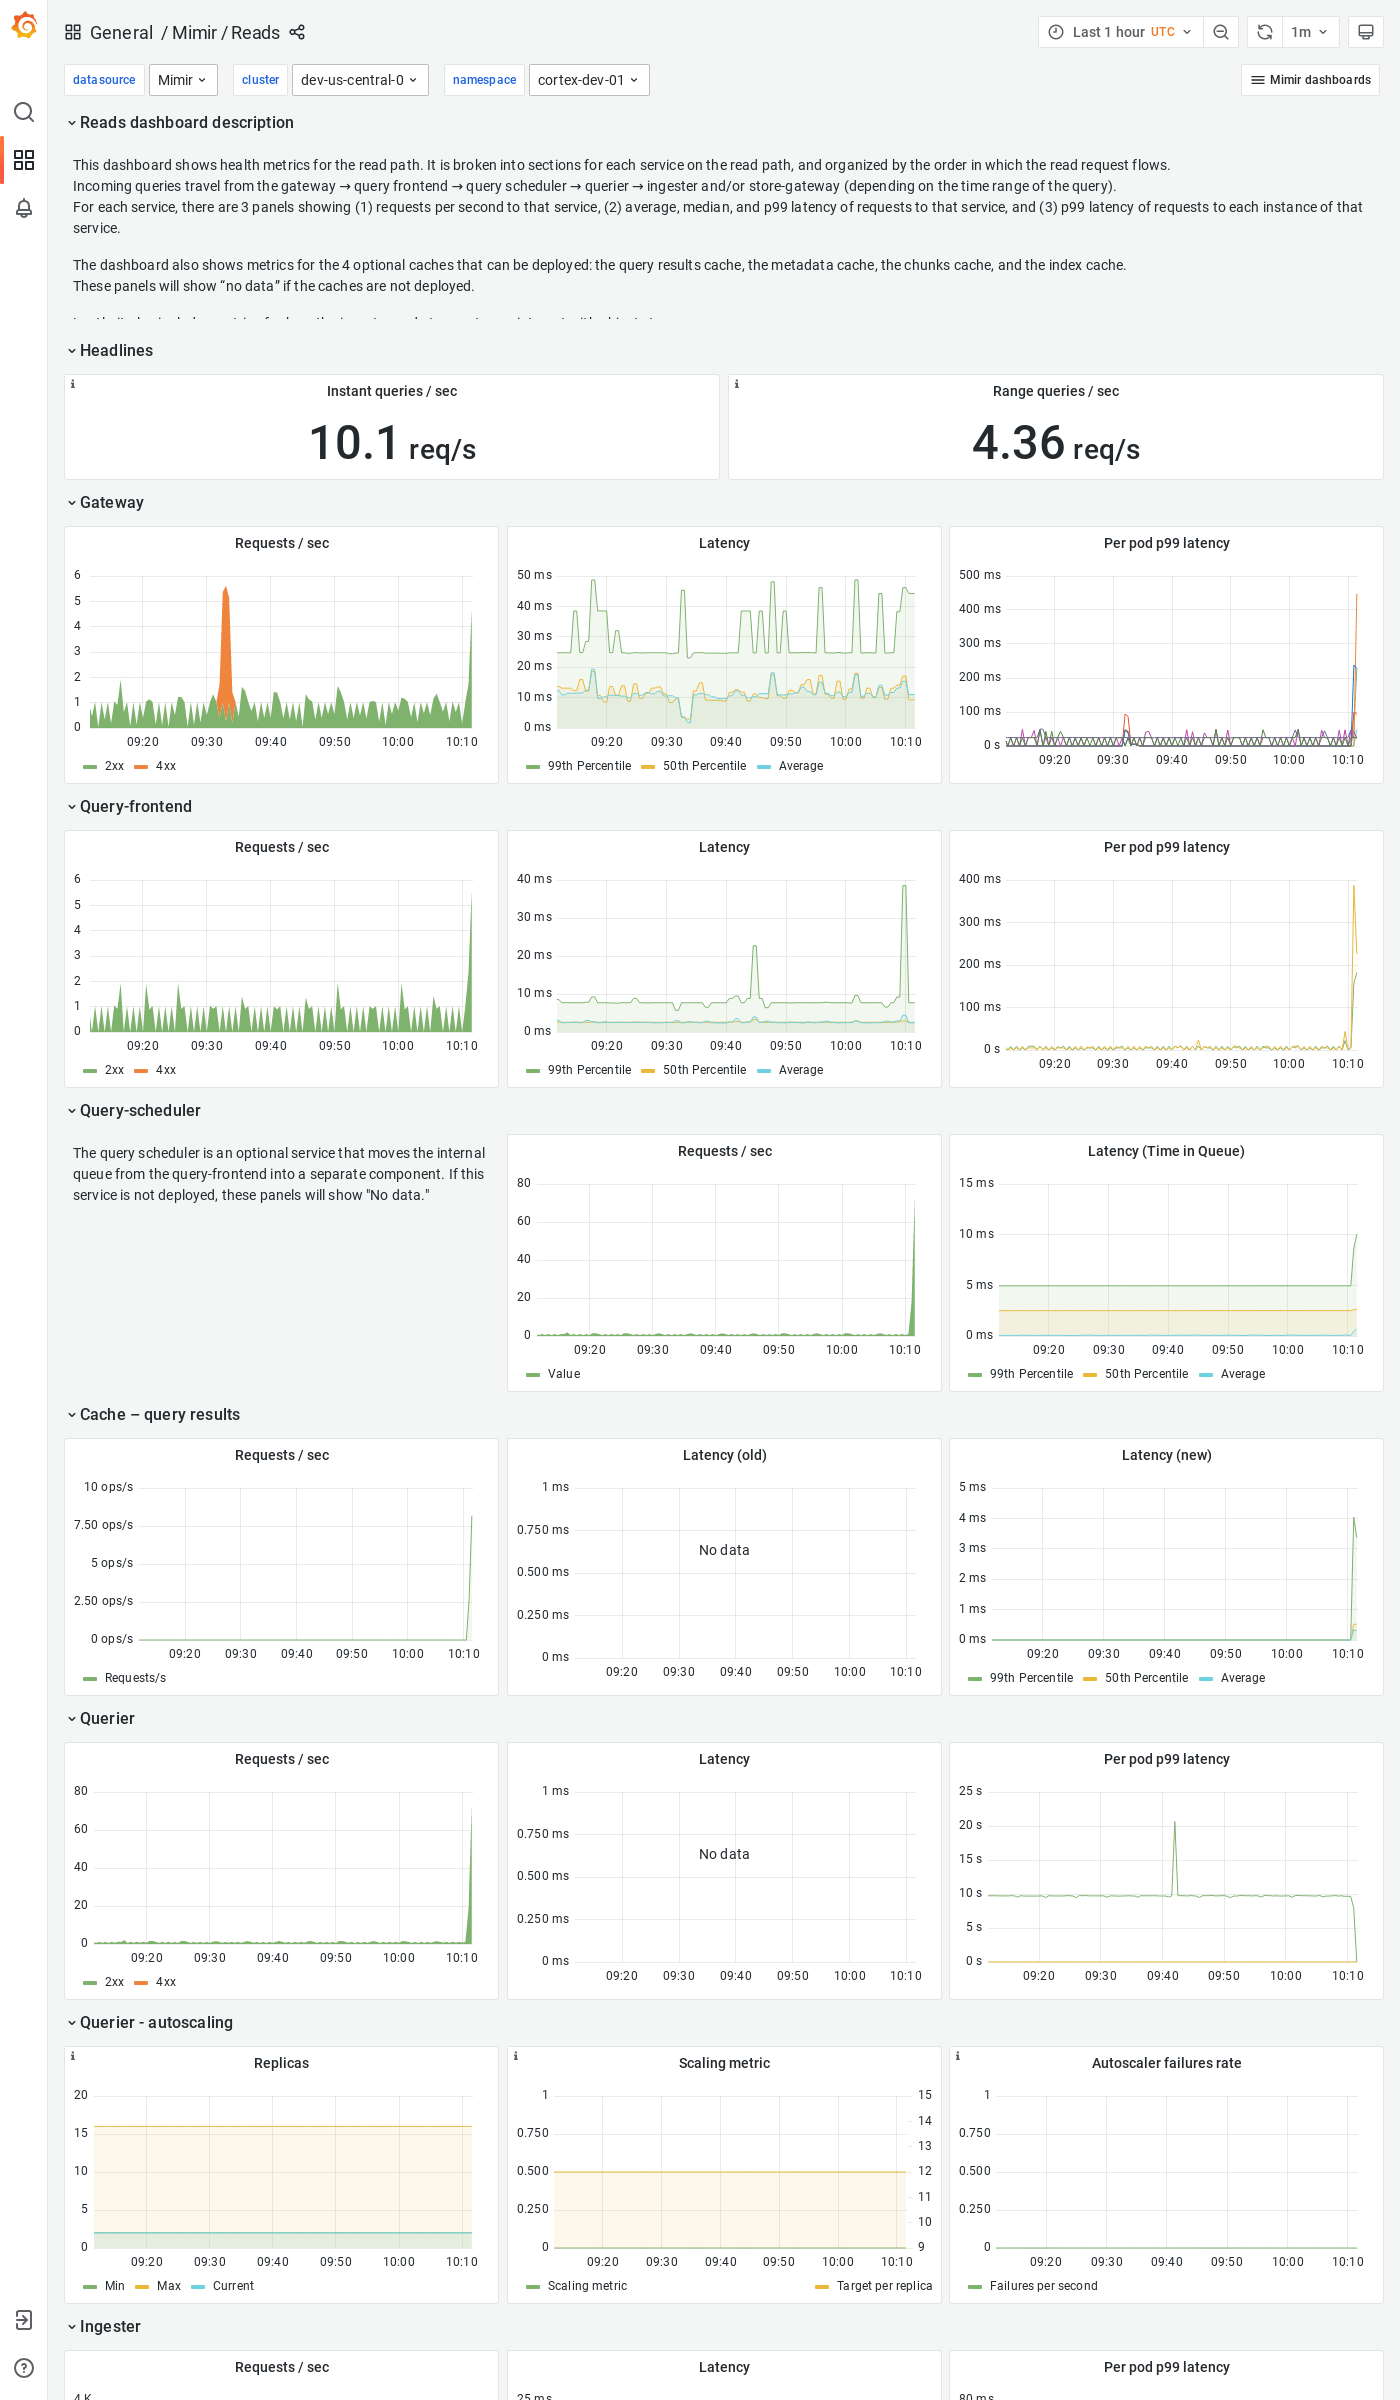
The Reads dashboard shows health metrics for the read path and object storage metrics for operations triggered by the read path.
The dashboard isolates each service on the read path into its own section and displays the order in which a read request flows.
Grafana Mimir is an open source software project that provides a scalable long-term storage for Prometheus. For more information, visit Grafana Mimir.
Data source config
Collector type:
Collector plugins:
Collector config:
Dashboard revisions
Upload an updated version of an exported dashboard.json file from Grafana
| Revision | Decscription | Created | |
|---|---|---|---|
| Download |
Sign up for Grafana Cloud

Get up and running in minutes with the Grafana Cloud free tier, which includes free forever 10k metrics, 50GB logs, 50GB traces, 500 VUh, and more.
Get this dashboard
Data source:
Dependencies: