
Prometheus system
Prometheus for system metrics. Load, CPU, RAM, network, process ...
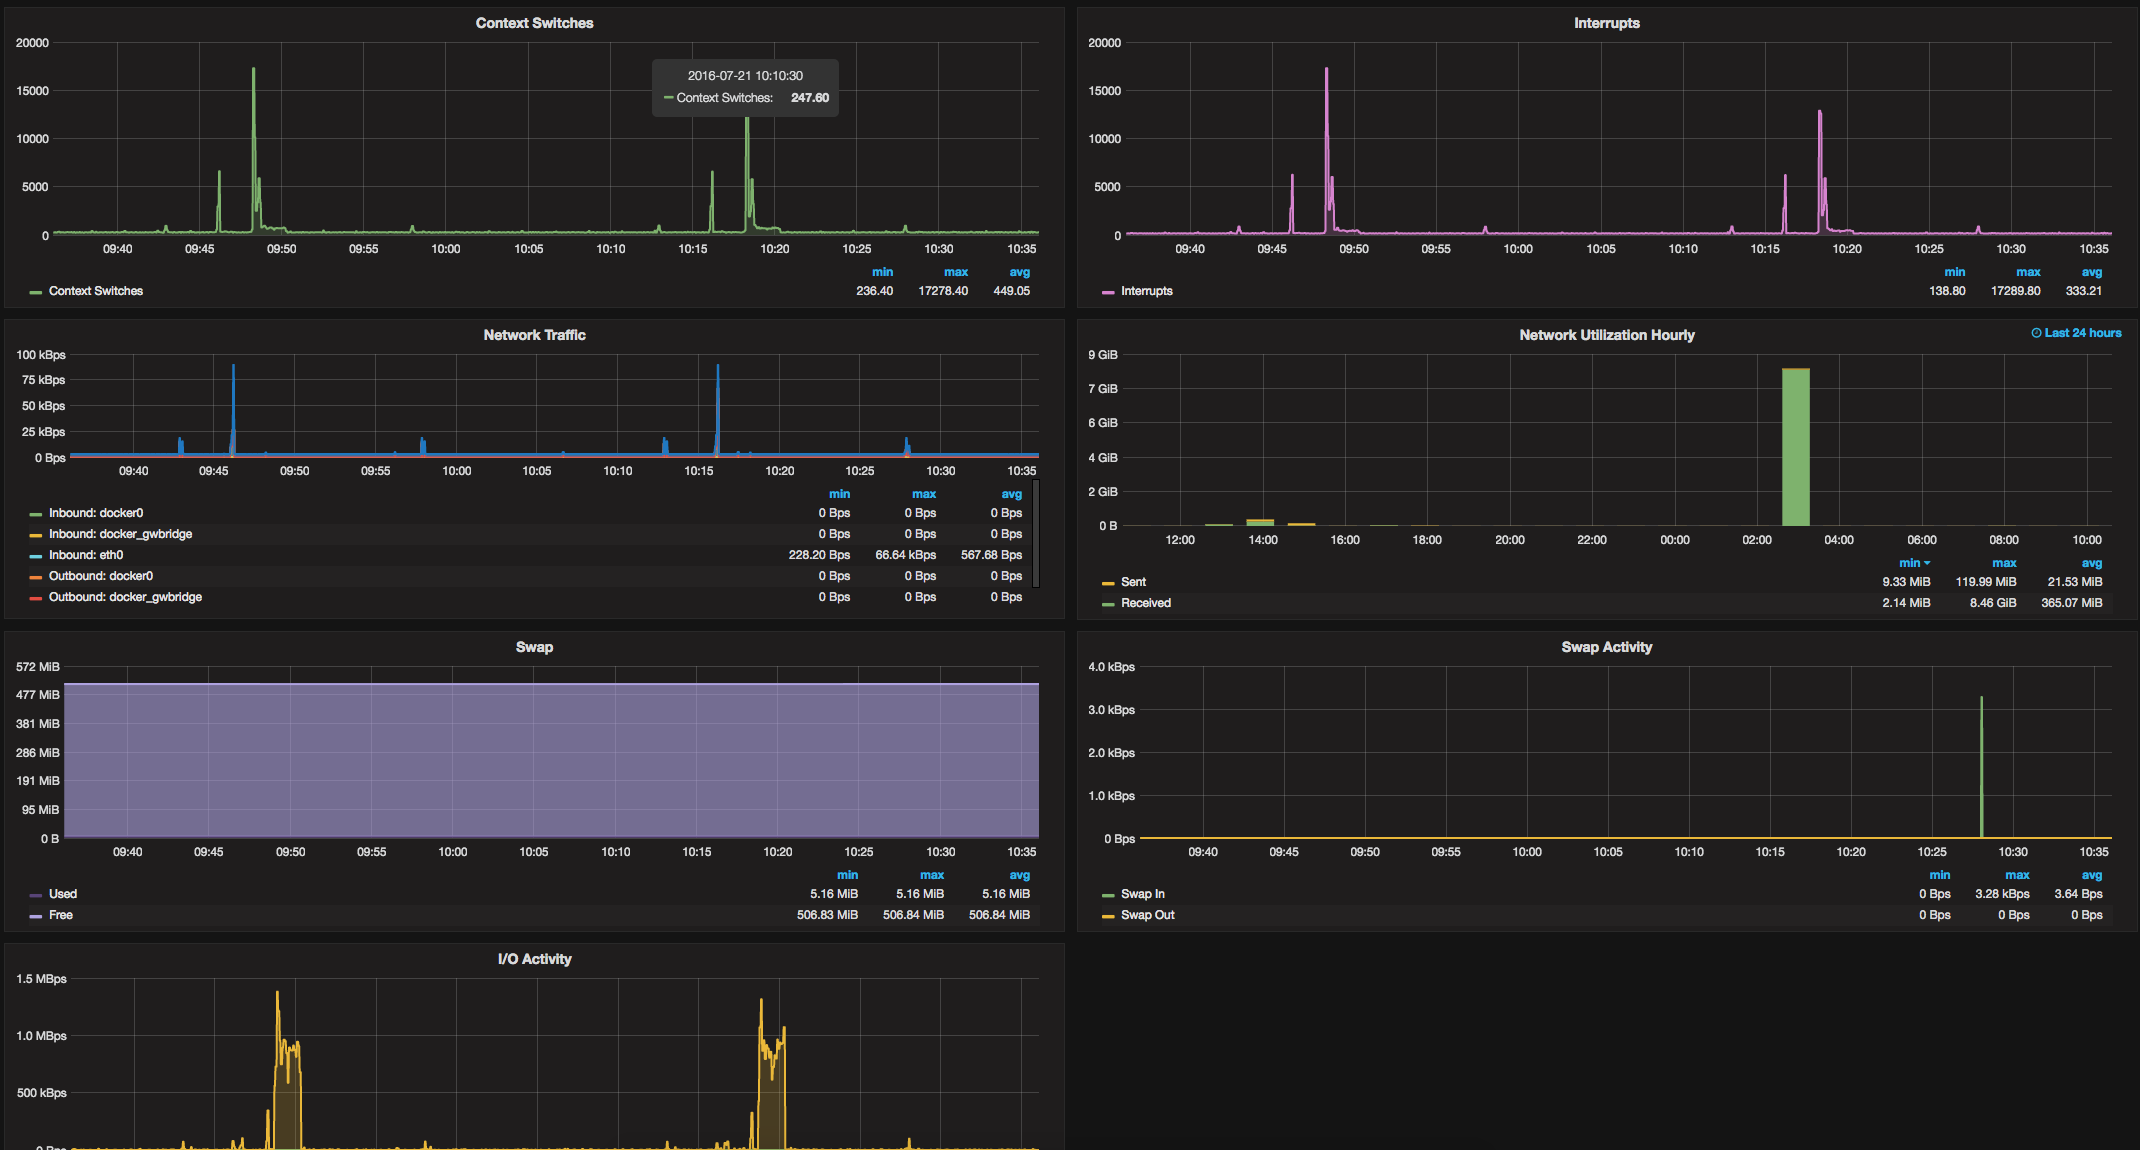
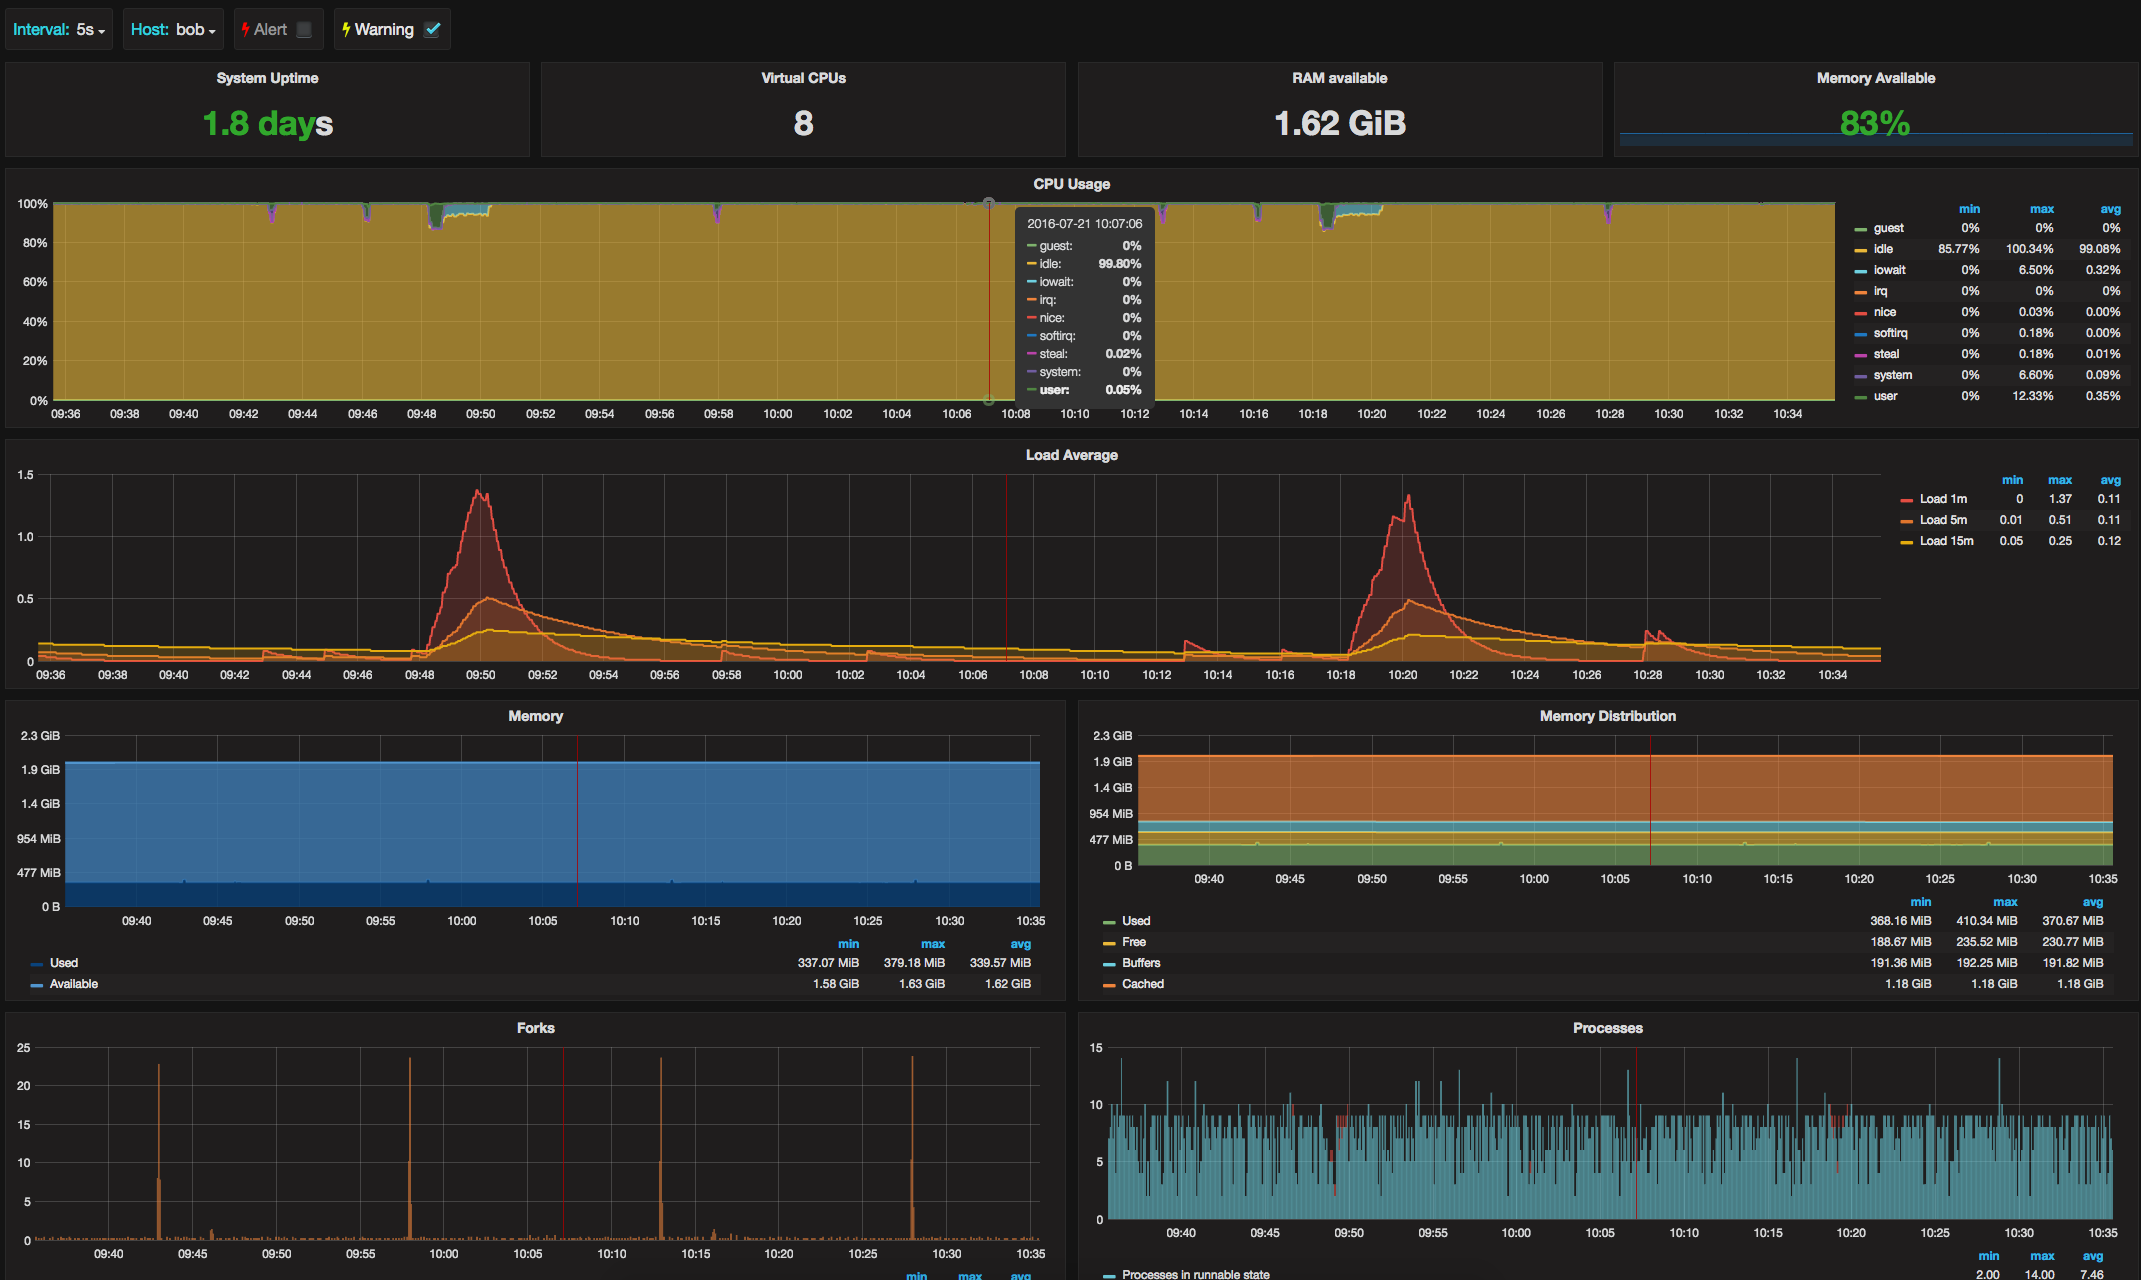
Show classical system metrics of your servers. It’s also linked alerts of the selected servers (if alert are set). Need to use tag name for servers. The tag used is “alias” but you can change it in templating.
Open issues or give feedback at : https://github.com/tcheronneau/grafana_dashboard
Data source config
Collector type:
Collector plugins:
Collector config:
Dashboard revisions
Upload an updated version of an exported dashboard.json file from Grafana
| Revision | Decscription | Created | |
|---|---|---|---|
| Download |
Sign up for Grafana Cloud

Get up and running in minutes with the Grafana Cloud free tier, which includes free forever 10k metrics, 50GB logs, 50GB traces, 500 VUh, and more.
Get this dashboard
Data source:
Dependencies: