Grafana Dashboard for User Audit VB365
Grafana Dashboard for User Audit for Restore Portal of Veeam Backup for Microsoft 365
Just download the latest required script version from GitHub https://raw.githubusercontent.com/jorgedlcruz/veeam-backup-restore-portal-audit/main/veeam_microsoft365_audit.sh and change the Configuration section within your details:
##
# Configurations
##
# Endpoint URL for InfluxDB
veeamInfluxDBURL="http://YOURINFLUXSERVERIP" #Your InfluxDB Server, http://FQDN or https://FQDN if using SSL
veeamInfluxDBPort="8086" #Default Port
veeamInfluxDBBucket="veeam" # InfluxDB bucket name (not ID)
veeamInfluxDBToken="TOKEN" # InfluxDB access token with read/write privileges for the bucket
veeamInfluxDBOrg="ORG NAME" # InfluxDB organisation name (not ID)
Endpoint Configuration for Azure AD
ApplicationID="YOURAPPLICATIONID" # You can find these on your VB365 Server, on the Restore Portal, or in Azure
TenatDomainName="YOURTENANTDOMAINNAME" # Easy to find this on the next URL - https://portal.azure.com/#blade/Microsoft_AAD_IAM/TenantPropertiesBlade
AccessSecret="YOURACCESSSECRET" # Create a new Client secret under your Veeam Restore Portal App registrations in Azure
Once the changes are done, make the script executable with chmod:
chmod +x veeam_microsoft365_audit.sh
The output of the command should be something like the next, without errors:
Writing veeam_microsoft365_auditPolicy to InfluxDB
HTTP/2 204
x-influxdb-build: OSS
x-influxdb-version: 2.1.1
date: Wed, 15 Dec 2021 16:14:56 GMT
If so, please now add this script to your crontab, like for example every 30 minutes:
*/30 * * * * /home/oper/veeam_microsoft365_audit.sh >> /var/log/veeam_microsoft365_audit.log 2>&1
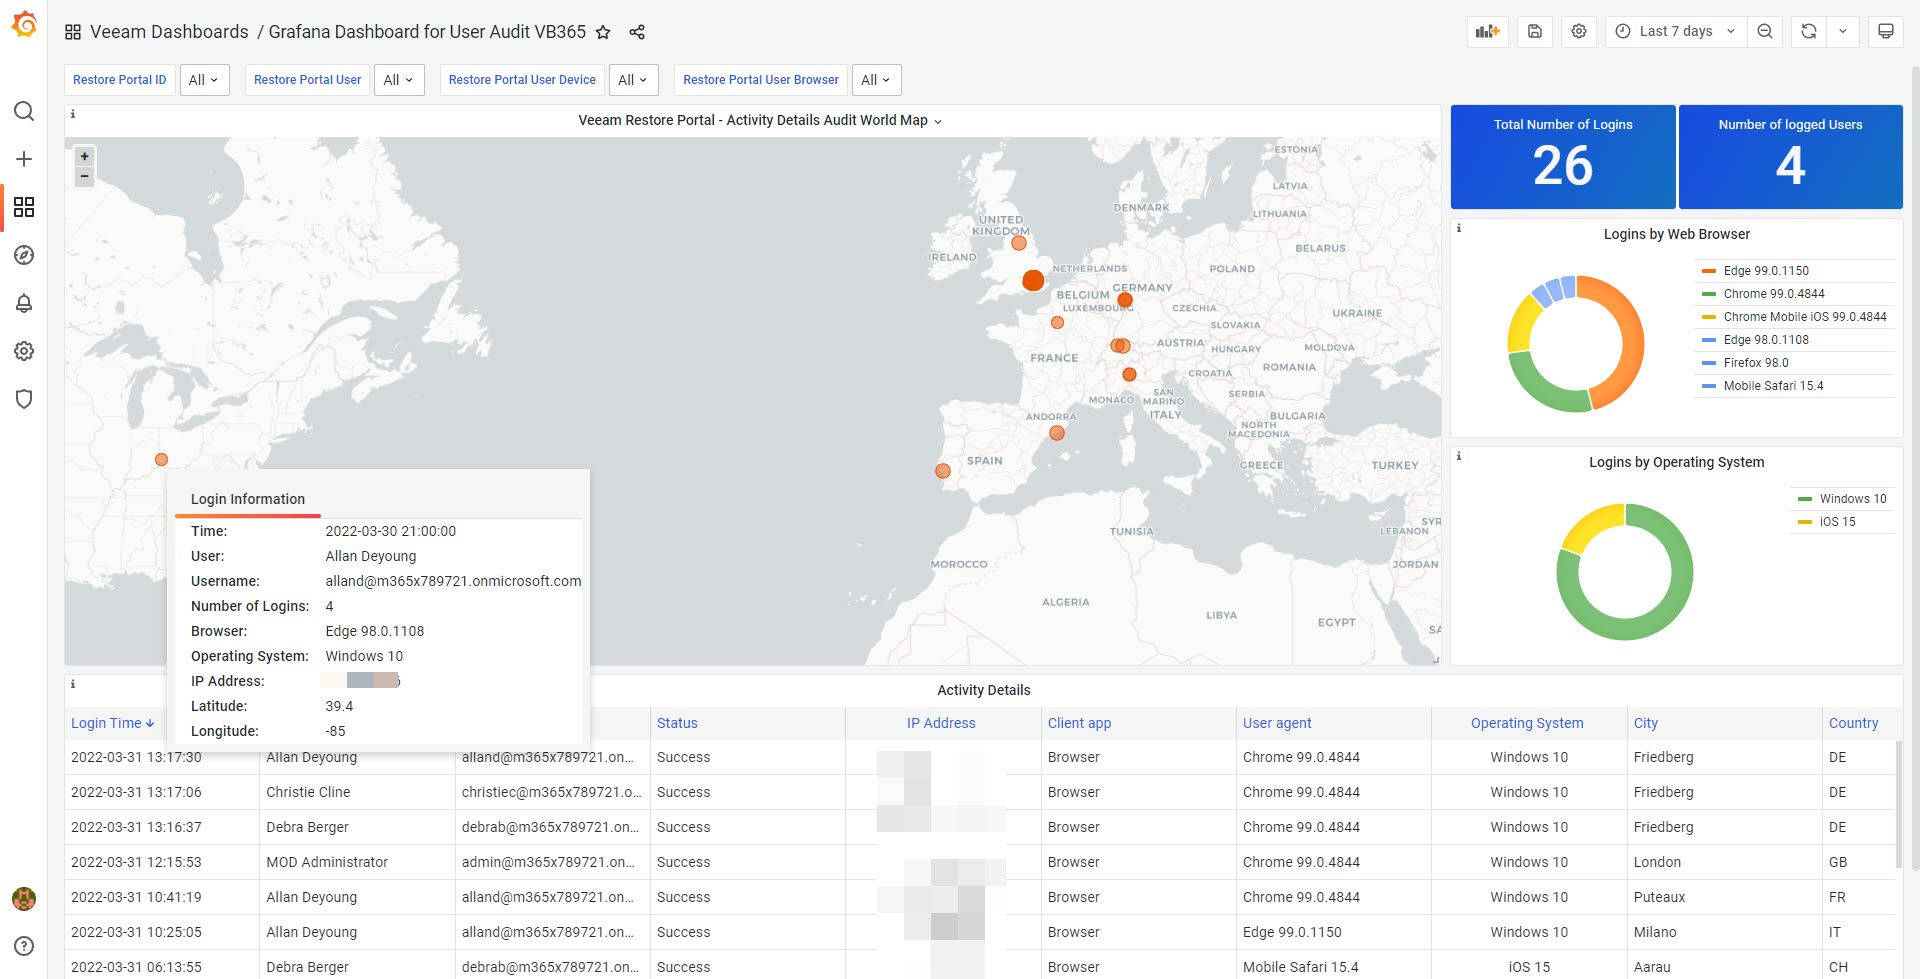
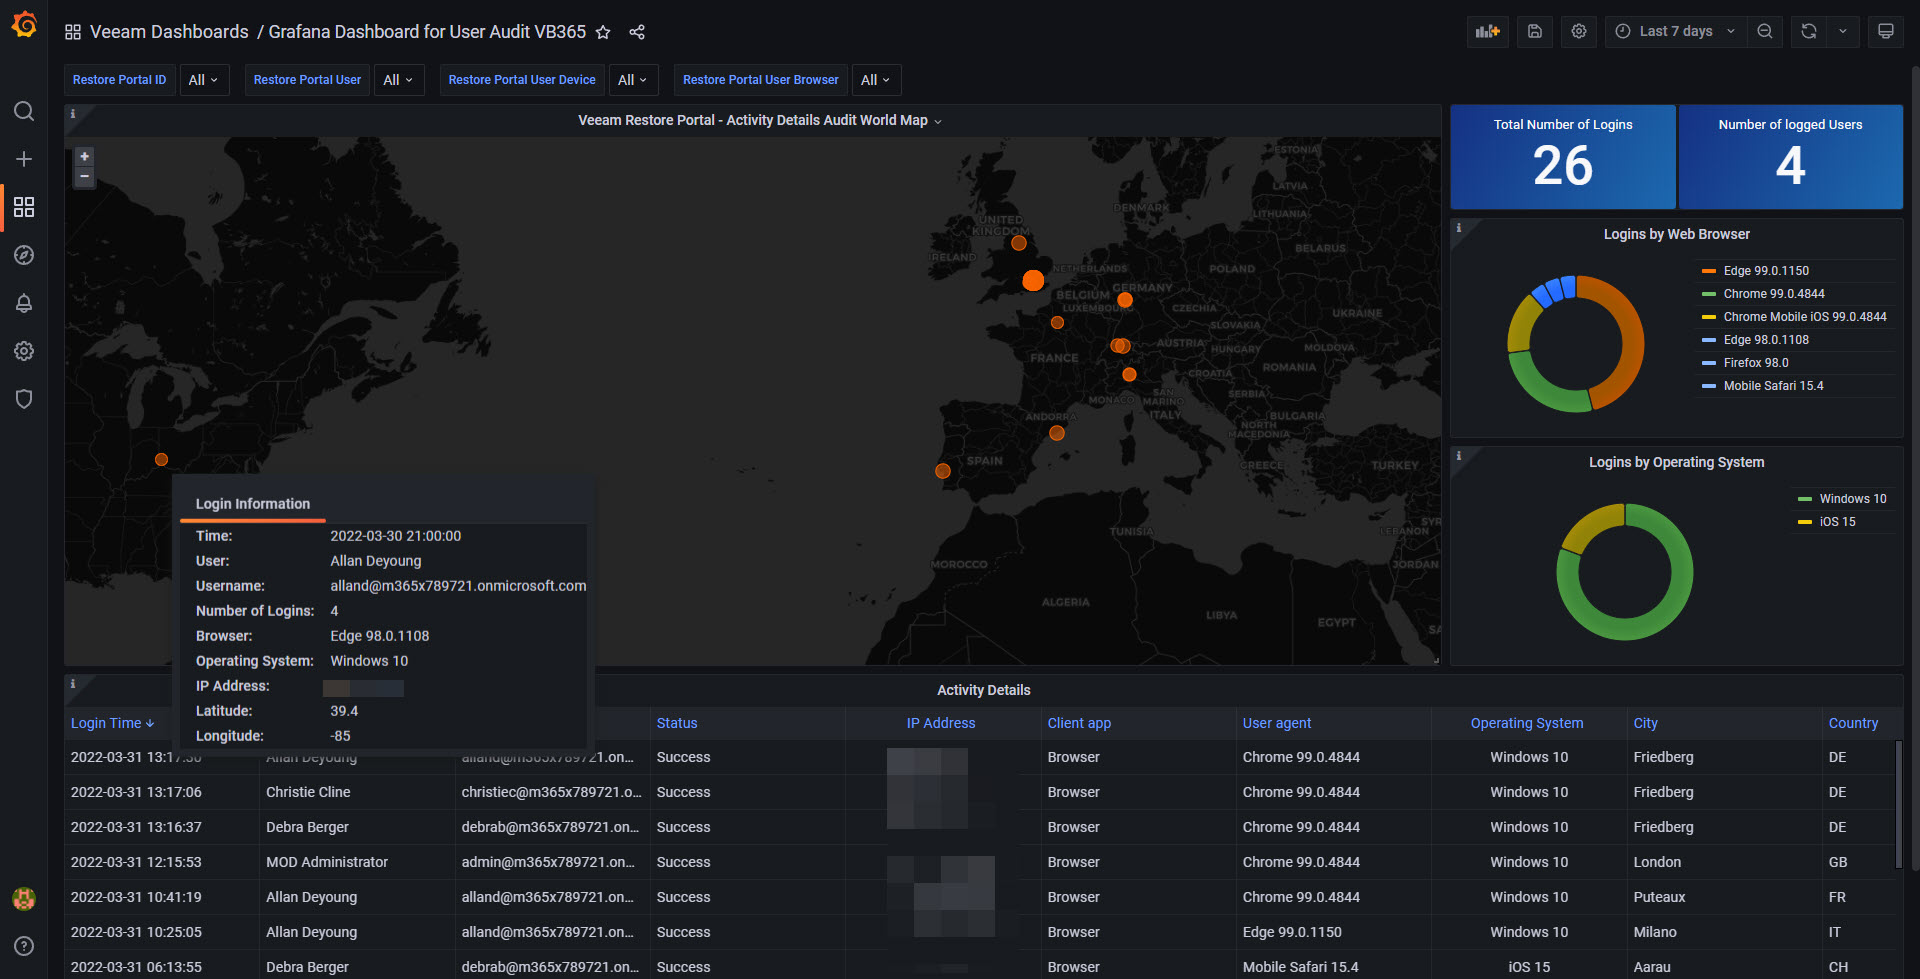
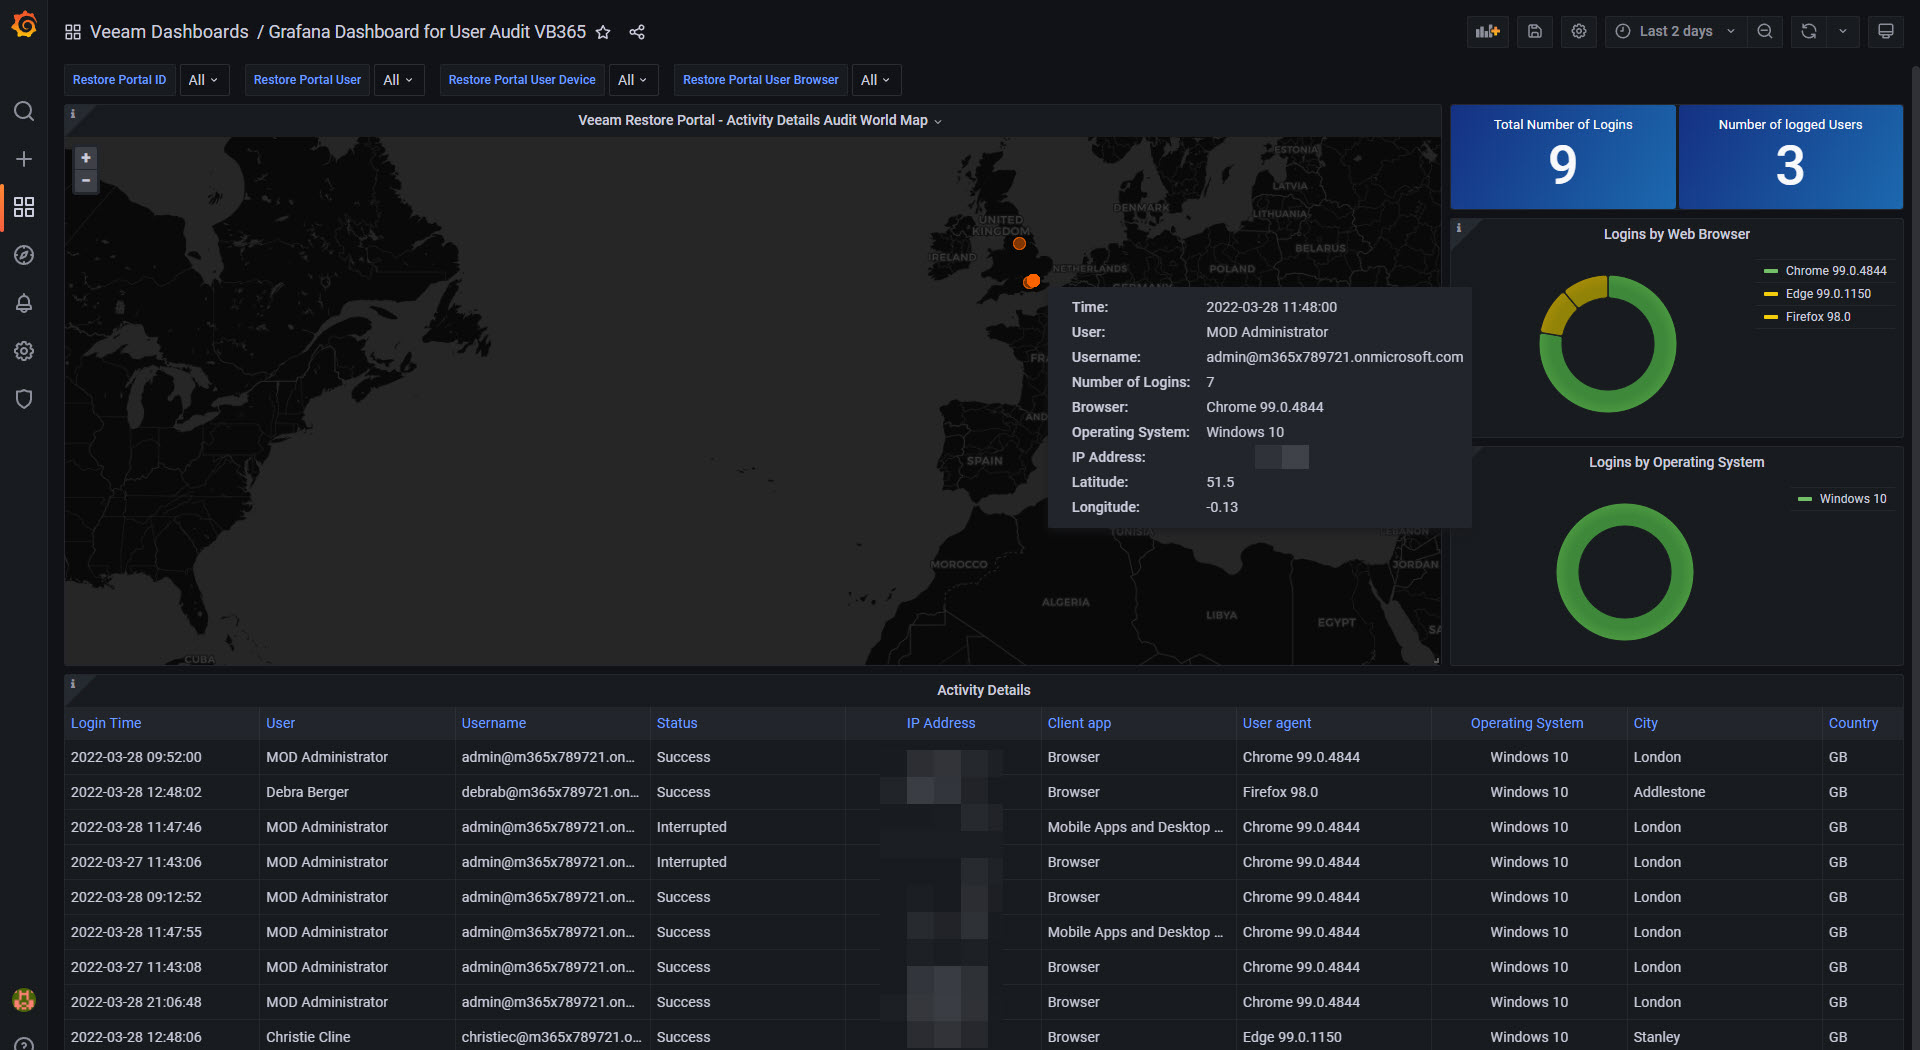
Then download or import this Dashboard to your Grafana, and you should see something similar to the next:
Data source config
Collector config:
Upload an updated version of an exported dashboard.json file from Grafana
| Revision | Description | Created | |
|---|---|---|---|
| Download |