OpenTelemetry Collector
Visualize OpenTelemetry (OTEL) collector metrics (tested with OTEL contrib v0.125.0)
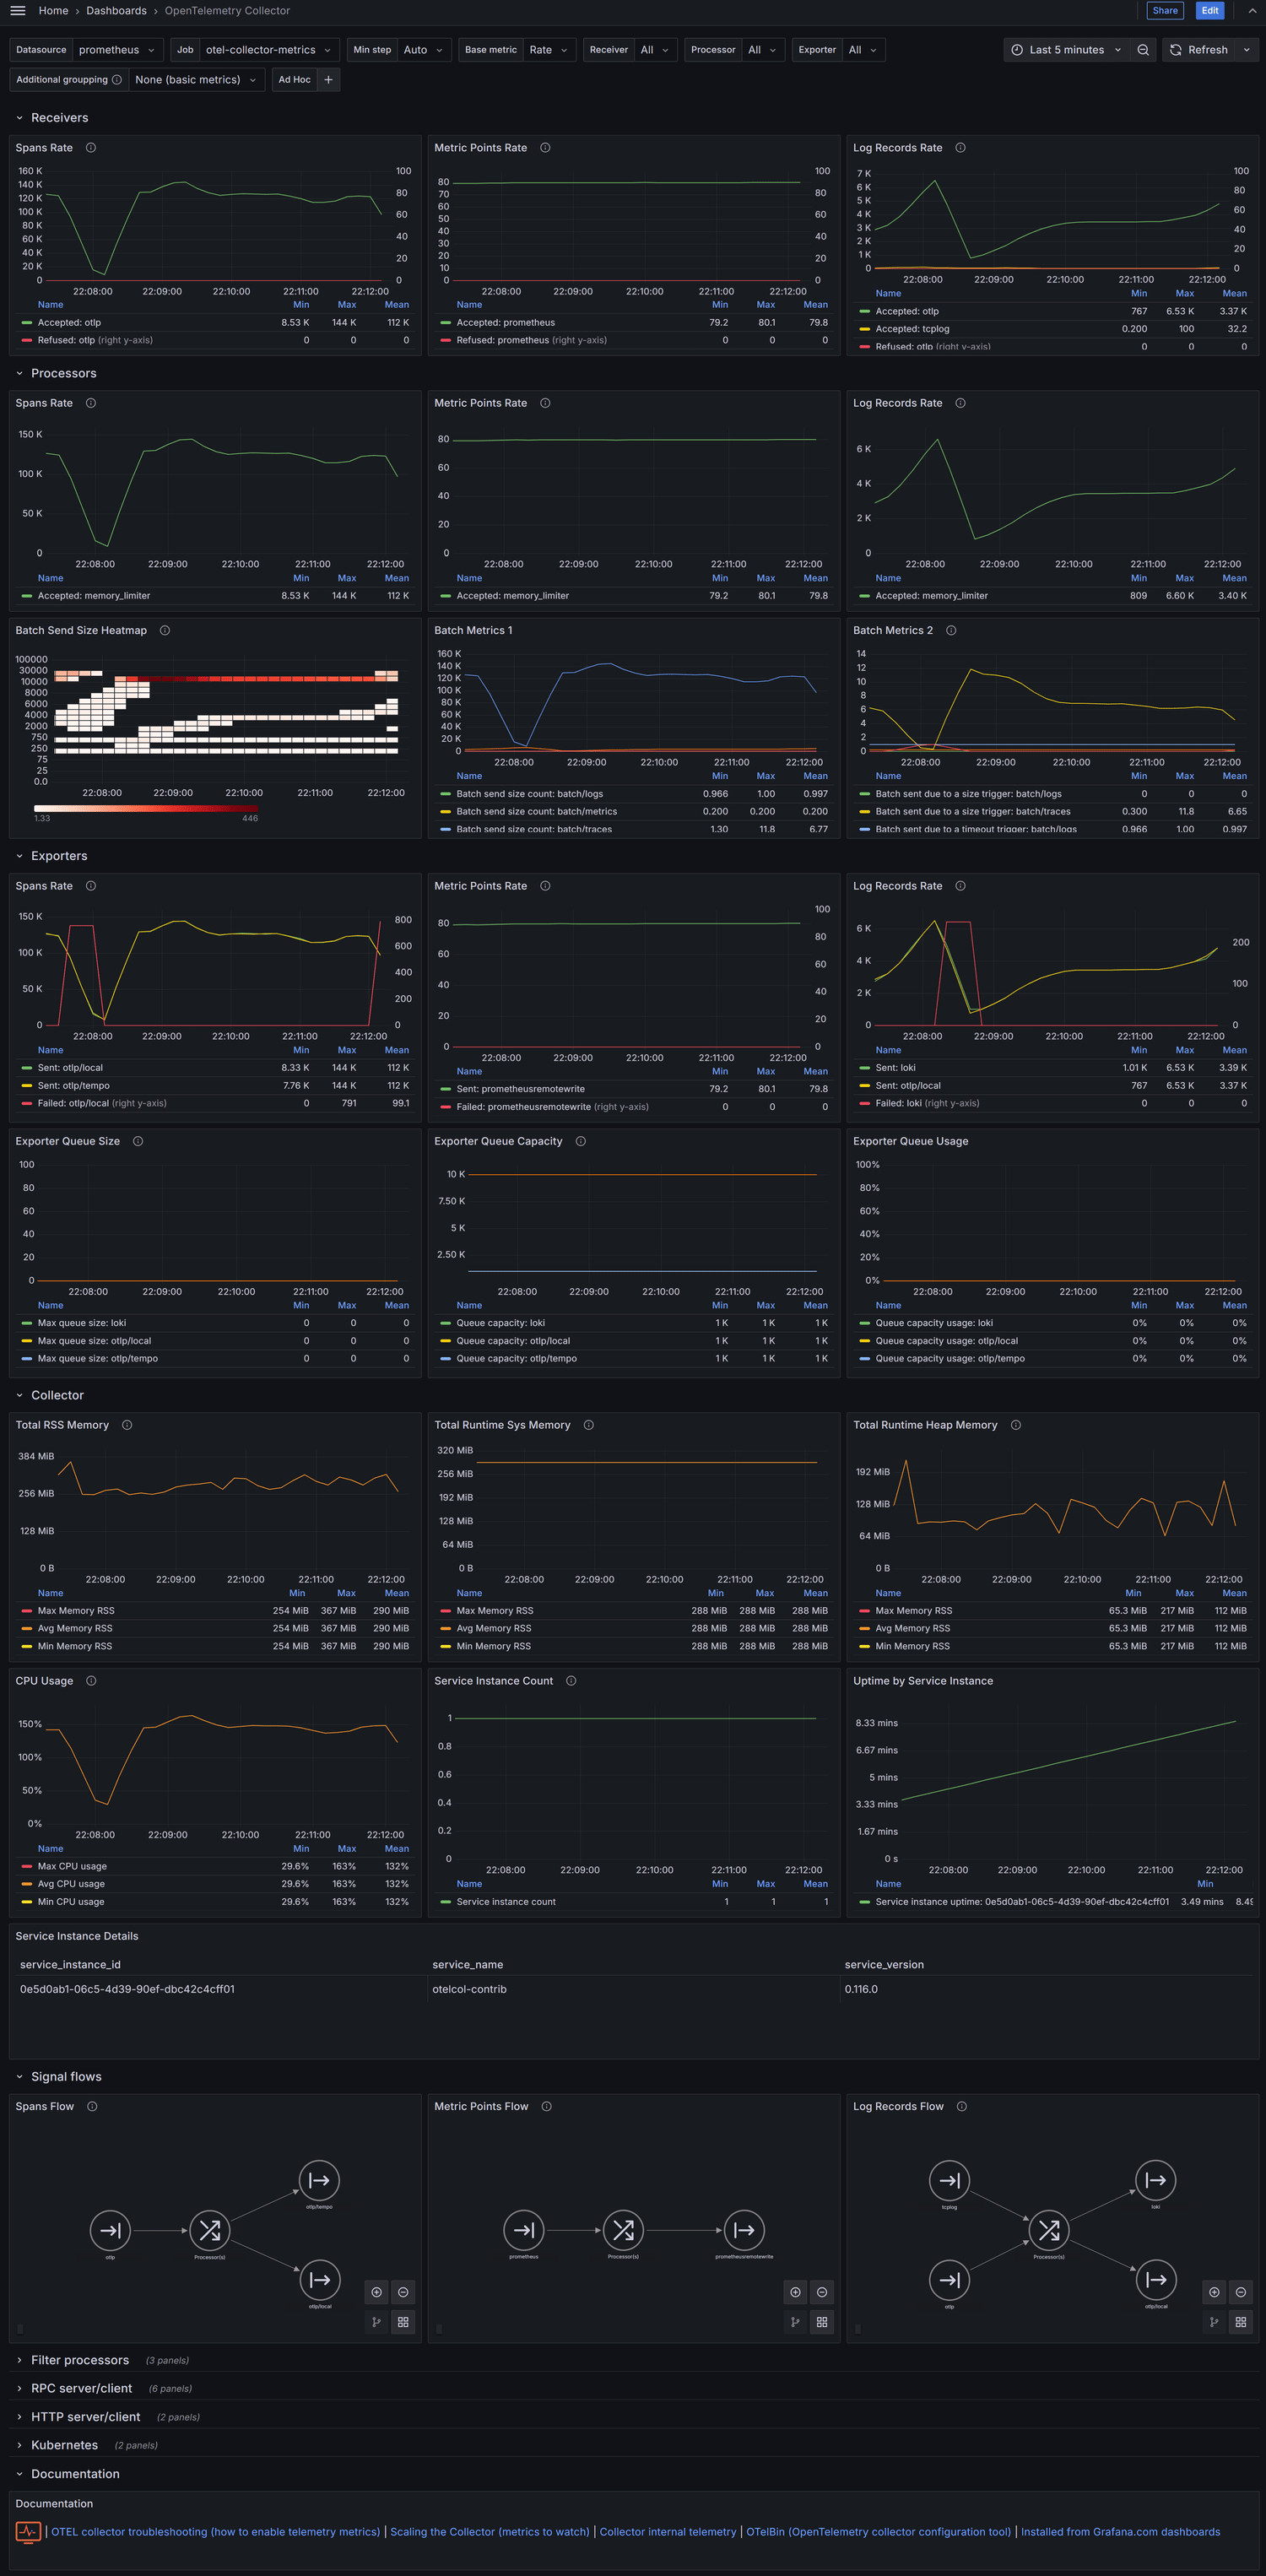
Visualisation of OpenTelemetry collector metrics from Prometheus.
Part of opentelemetry-collector-monitoring repo.
This dashboard can also be used partially for Alloy monitoring (mainly for OTEL components).
Metric name/label name conventions
OpenTelemetry collector metrics and label names can vary significantly. These variations depend on several factors:
- OpenTelemetry Collector version
- Specific receivers/exporters in use
- Receiver/exporter configuration settings
- Metric storage backend configuration
For example uptime metric can be saved as:
otelcol_process_uptime{service_instance_id="123456", ...}
otelcol_process_uptime_total{service_instance_id="123456", ...}
otelcol_process_uptime_seconds_total{service_instance_id="123456", ...}
otelcol_process_uptime_seconds_total{service.instance.id="123456", ...}
otelcol_process_uptime_seconds_total_total{service.instance.id="123456", ...}
This dashboard attempts to detect all these variations through hidden dashboard variables to ensure compatibility across different configurations.
Collector configuration, where the collector collects their own metrics and posts them to Prometheus:
extensions:
  sigv4auth/aws:
receivers:
prometheus:
config:
scrape_configs:
- job_name: otel-collector-metrics
scrape_interval: 10s
static_configs:
- targets: ['localhost:8888']
exporters:
AWS Managed Prometheus example
prometheusremotewrite/aws:
endpoint: https://aps-workspaces.<region>.amazonaws.com/workspaces/<workspace-id>/api/v1/remote_write
auth:
authenticator: sigv4auth/aws
Grafana Cloud example
prometheusremotewrite/grafanacloud:
# check your Grafana Cloud admin console for correct hostname
endpoint: https://prometheus-prod-11-prod-us-central-0.grafana.net/api/prom

headers:
# hardcoded base64 value in auth header or use basicauth extension
"Authorization": "Basic <base64(username:password)>"
Prometheus server example
prometheusremotewrite/my-prometheus:
# my-prometheus server must have '–enable-feature=remote-write-receiver'
endpoint: https://my-prometheus/api/v1/write
service:
pipelines:
metrics:
receivers: [prometheus]
processors: []
# use configured prometheusremotewrite exporter
exporters: [prometheusremotewrite]
telemetry:
metrics:
address: 0.0.0.0:8888
level: detailed
See: collector monitoring doc and collector troubleshooting - metrics.
Data source config
Collector config:
Upload an updated version of an exported dashboard.json file from Grafana
| Revision | Description | Created | |
|---|---|---|---|
| Download |