Azure / Insights / Virtual Machines by Workspace
This dashboard shows the performance and health of Azure Virtual Machines via different metrics collected by Azure Monitor VM Insights. Filter data by Workspace
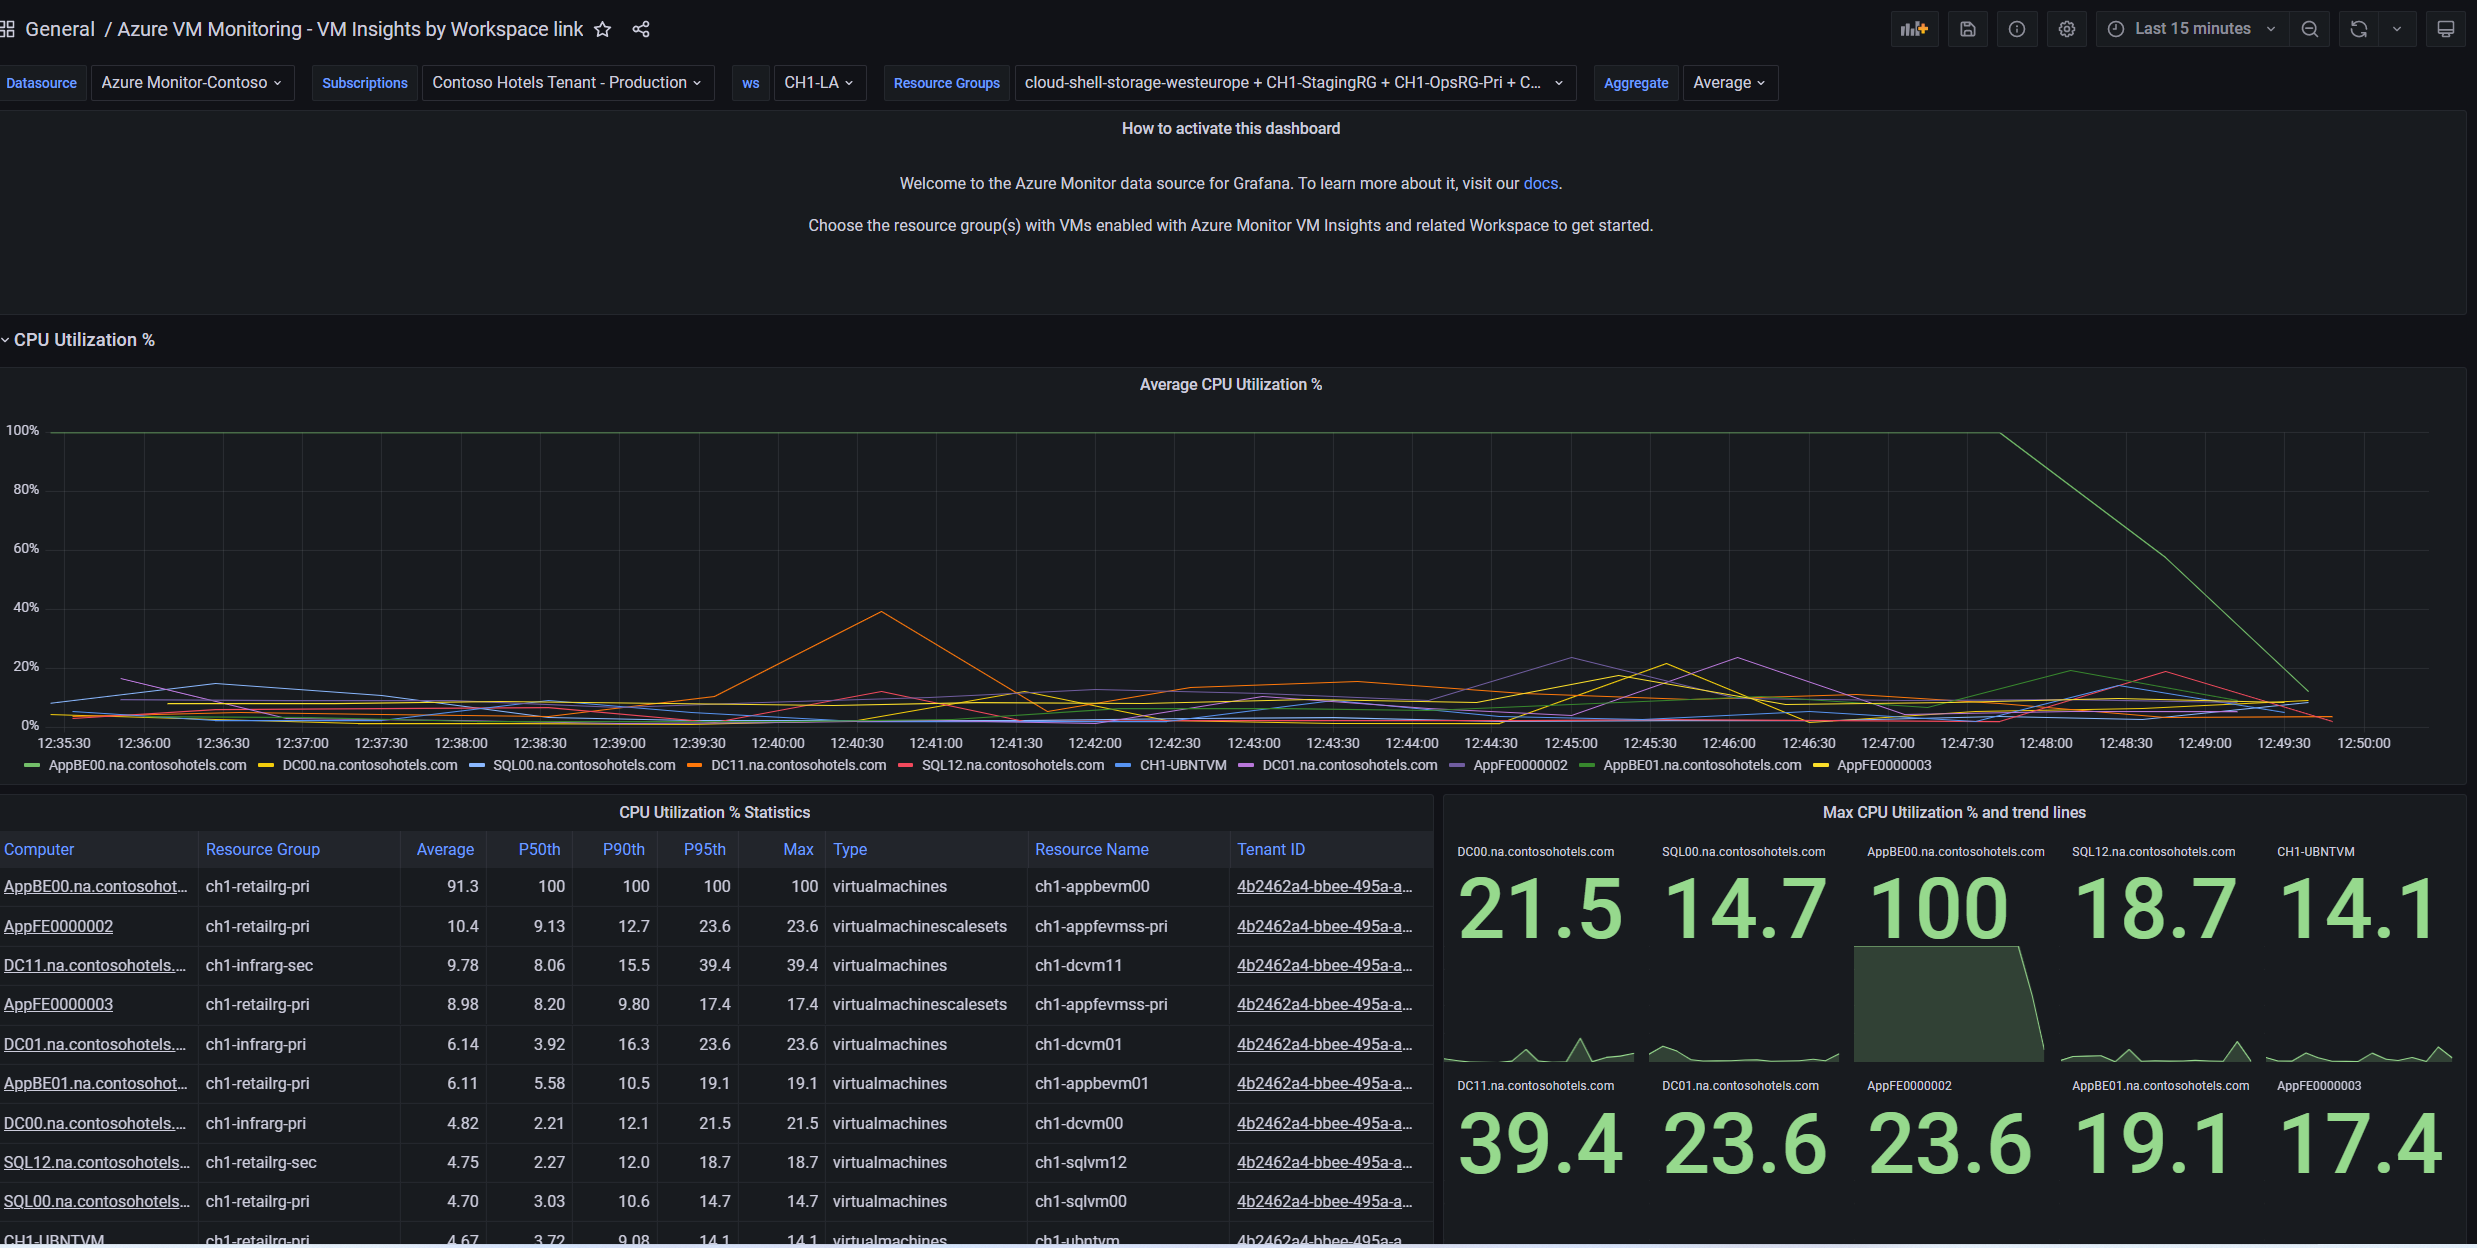
Using Azure Monitor data source, this dashboard provides insights for VM monitoring through a number of VM Insights metrics. You will be able to access key details on metrics like CPU Utilization %, Available Memory, Network Bytes Sent, Network Bytes Received and Logical Disk Space Used %. Use this dashboard if you would like to filter data by workspace.
More information:
Send your feedback to azmongrafana@microsoft.com
Data source config
Collector config:
Upload an updated version of an exported dashboard.json file from Grafana
| Revision | Description | Created | |
|---|---|---|---|
| Download |
Azure Cosmos DB
With the Grafana plugin for Azure Cosmos DB, you can quickly visualize and query your Azure Cosmos DB data from within Grafana.
Learn more