Chaos Mesh | Chaos Daemon
Monitoring performance data provided by chaos-daemon, which is the powerful agent in Chaos Mesh. Providing metrics about networking and background-process-manager.
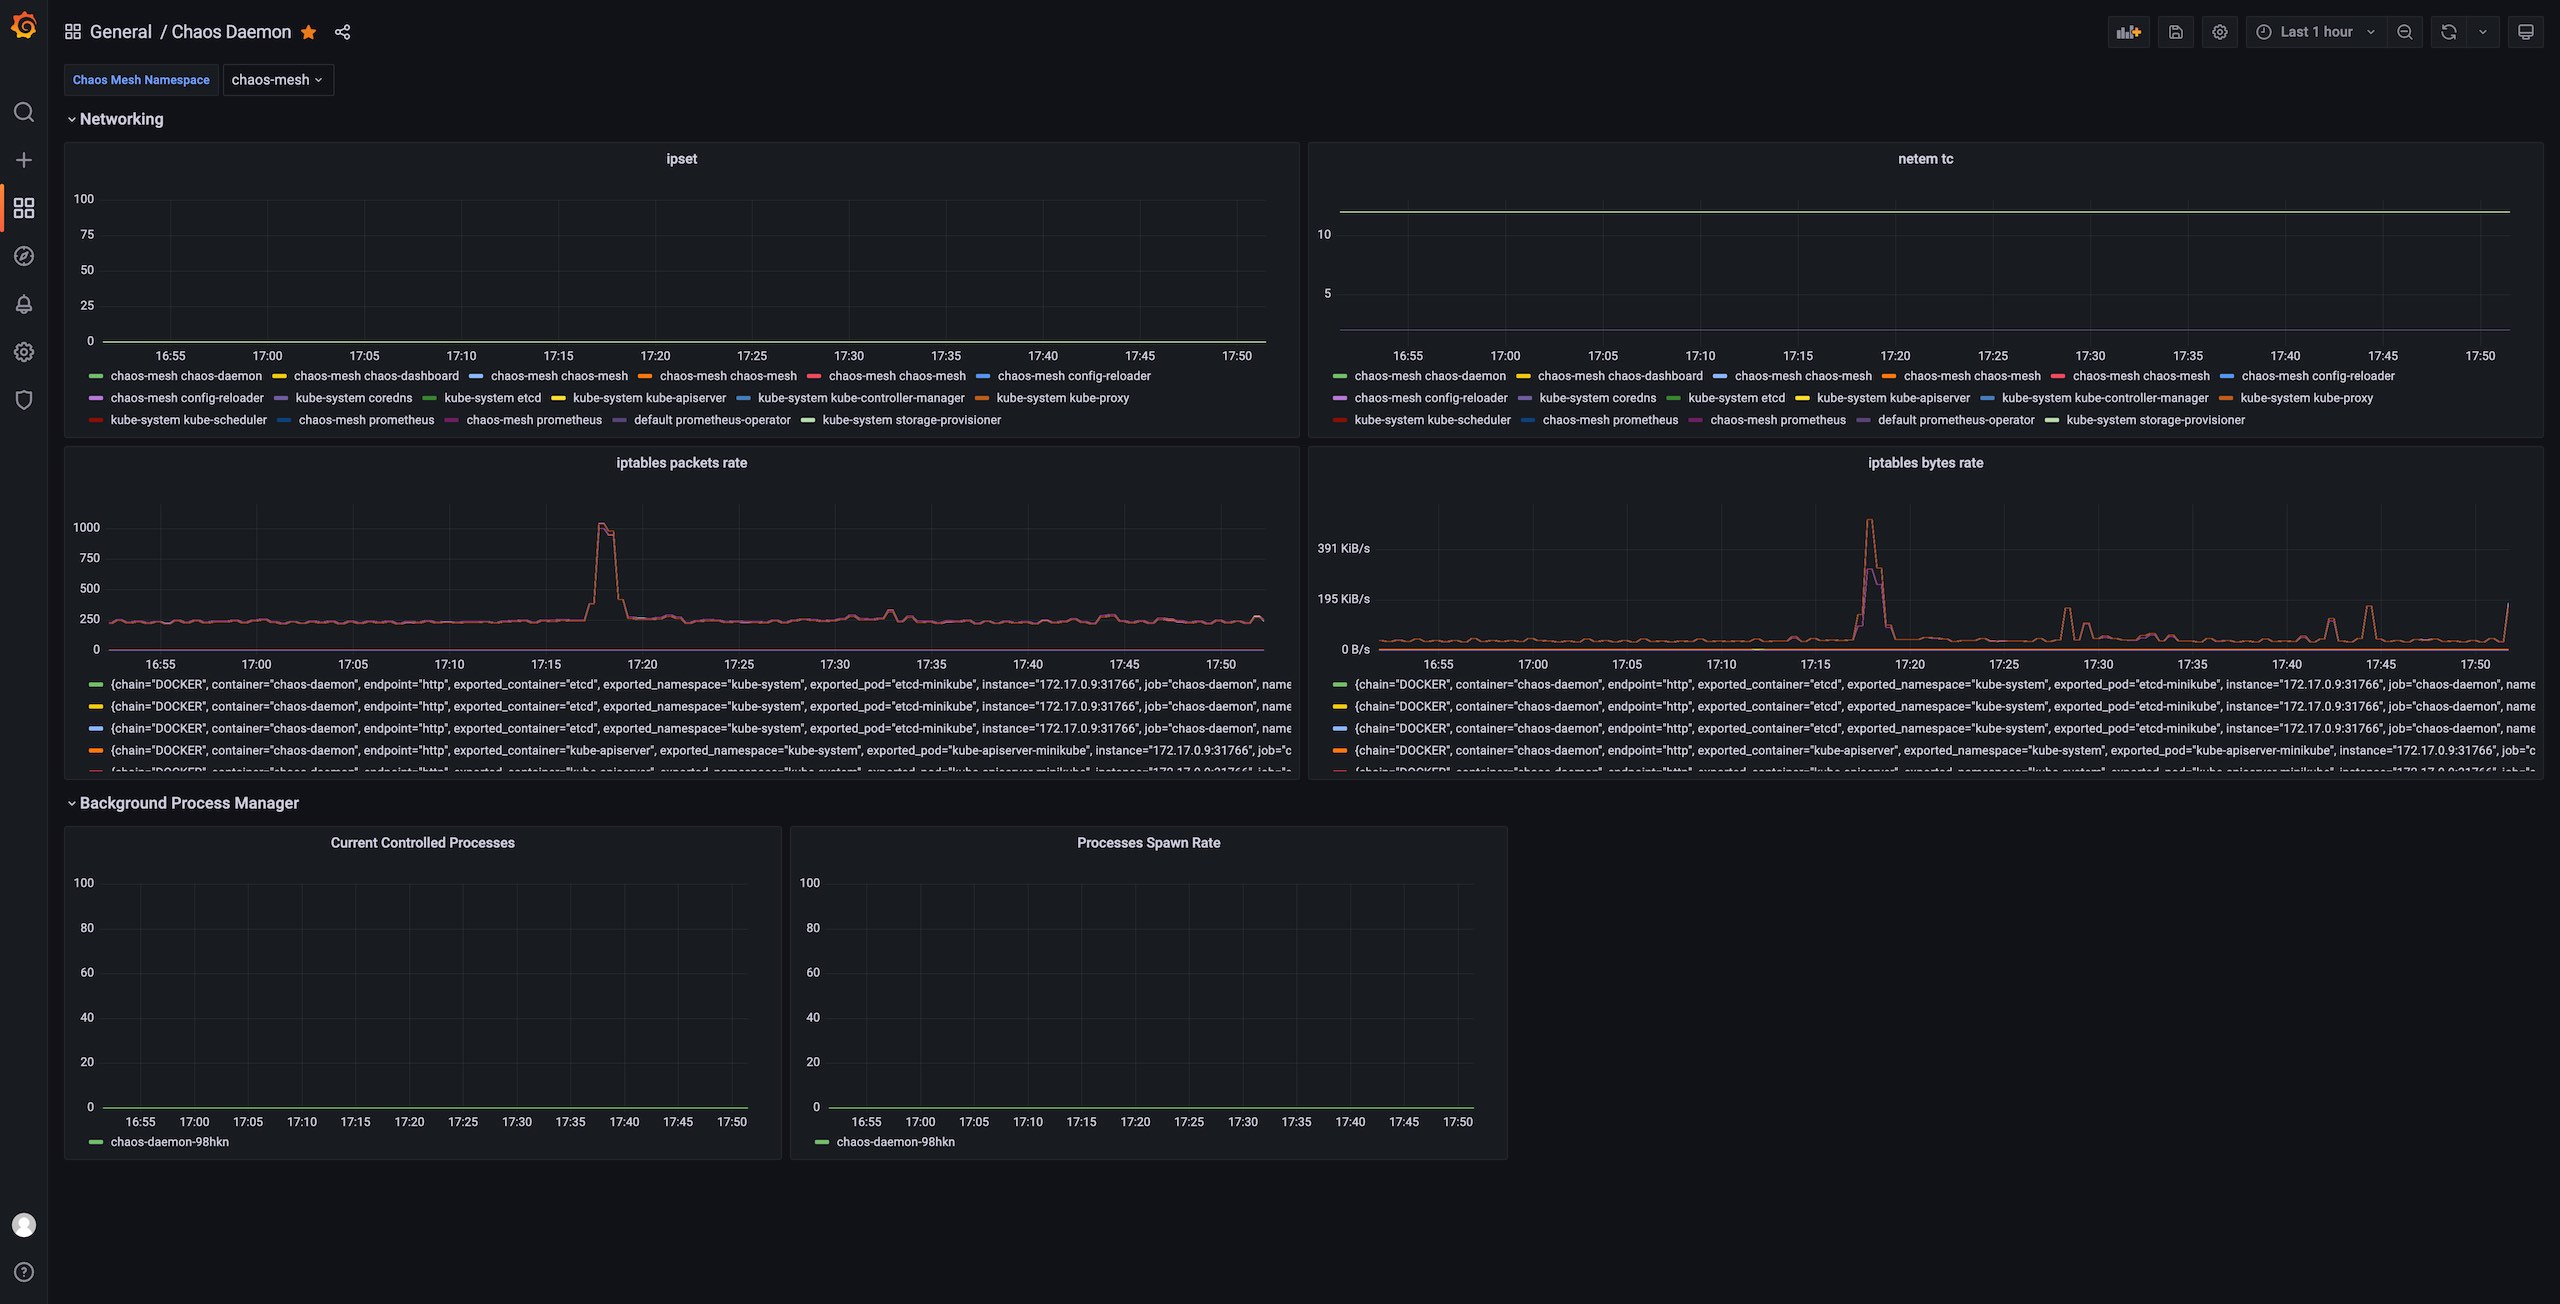
The Chaos Mesh | Chaos Daemon dashboard uses the prometheus data source to create a Grafana dashboard with the timeseries panel.
Data source config
Collector type:
Collector plugins:
Collector config:
Revisions
Upload an updated version of an exported dashboard.json file from Grafana
| Revision | Description | Created | |
|---|---|---|---|
| Download |