Chaos Mesh Overview
Overview for monitoring Chaos Mesh. Providing active chaos experiments, instances of each components, and experiments activity events.
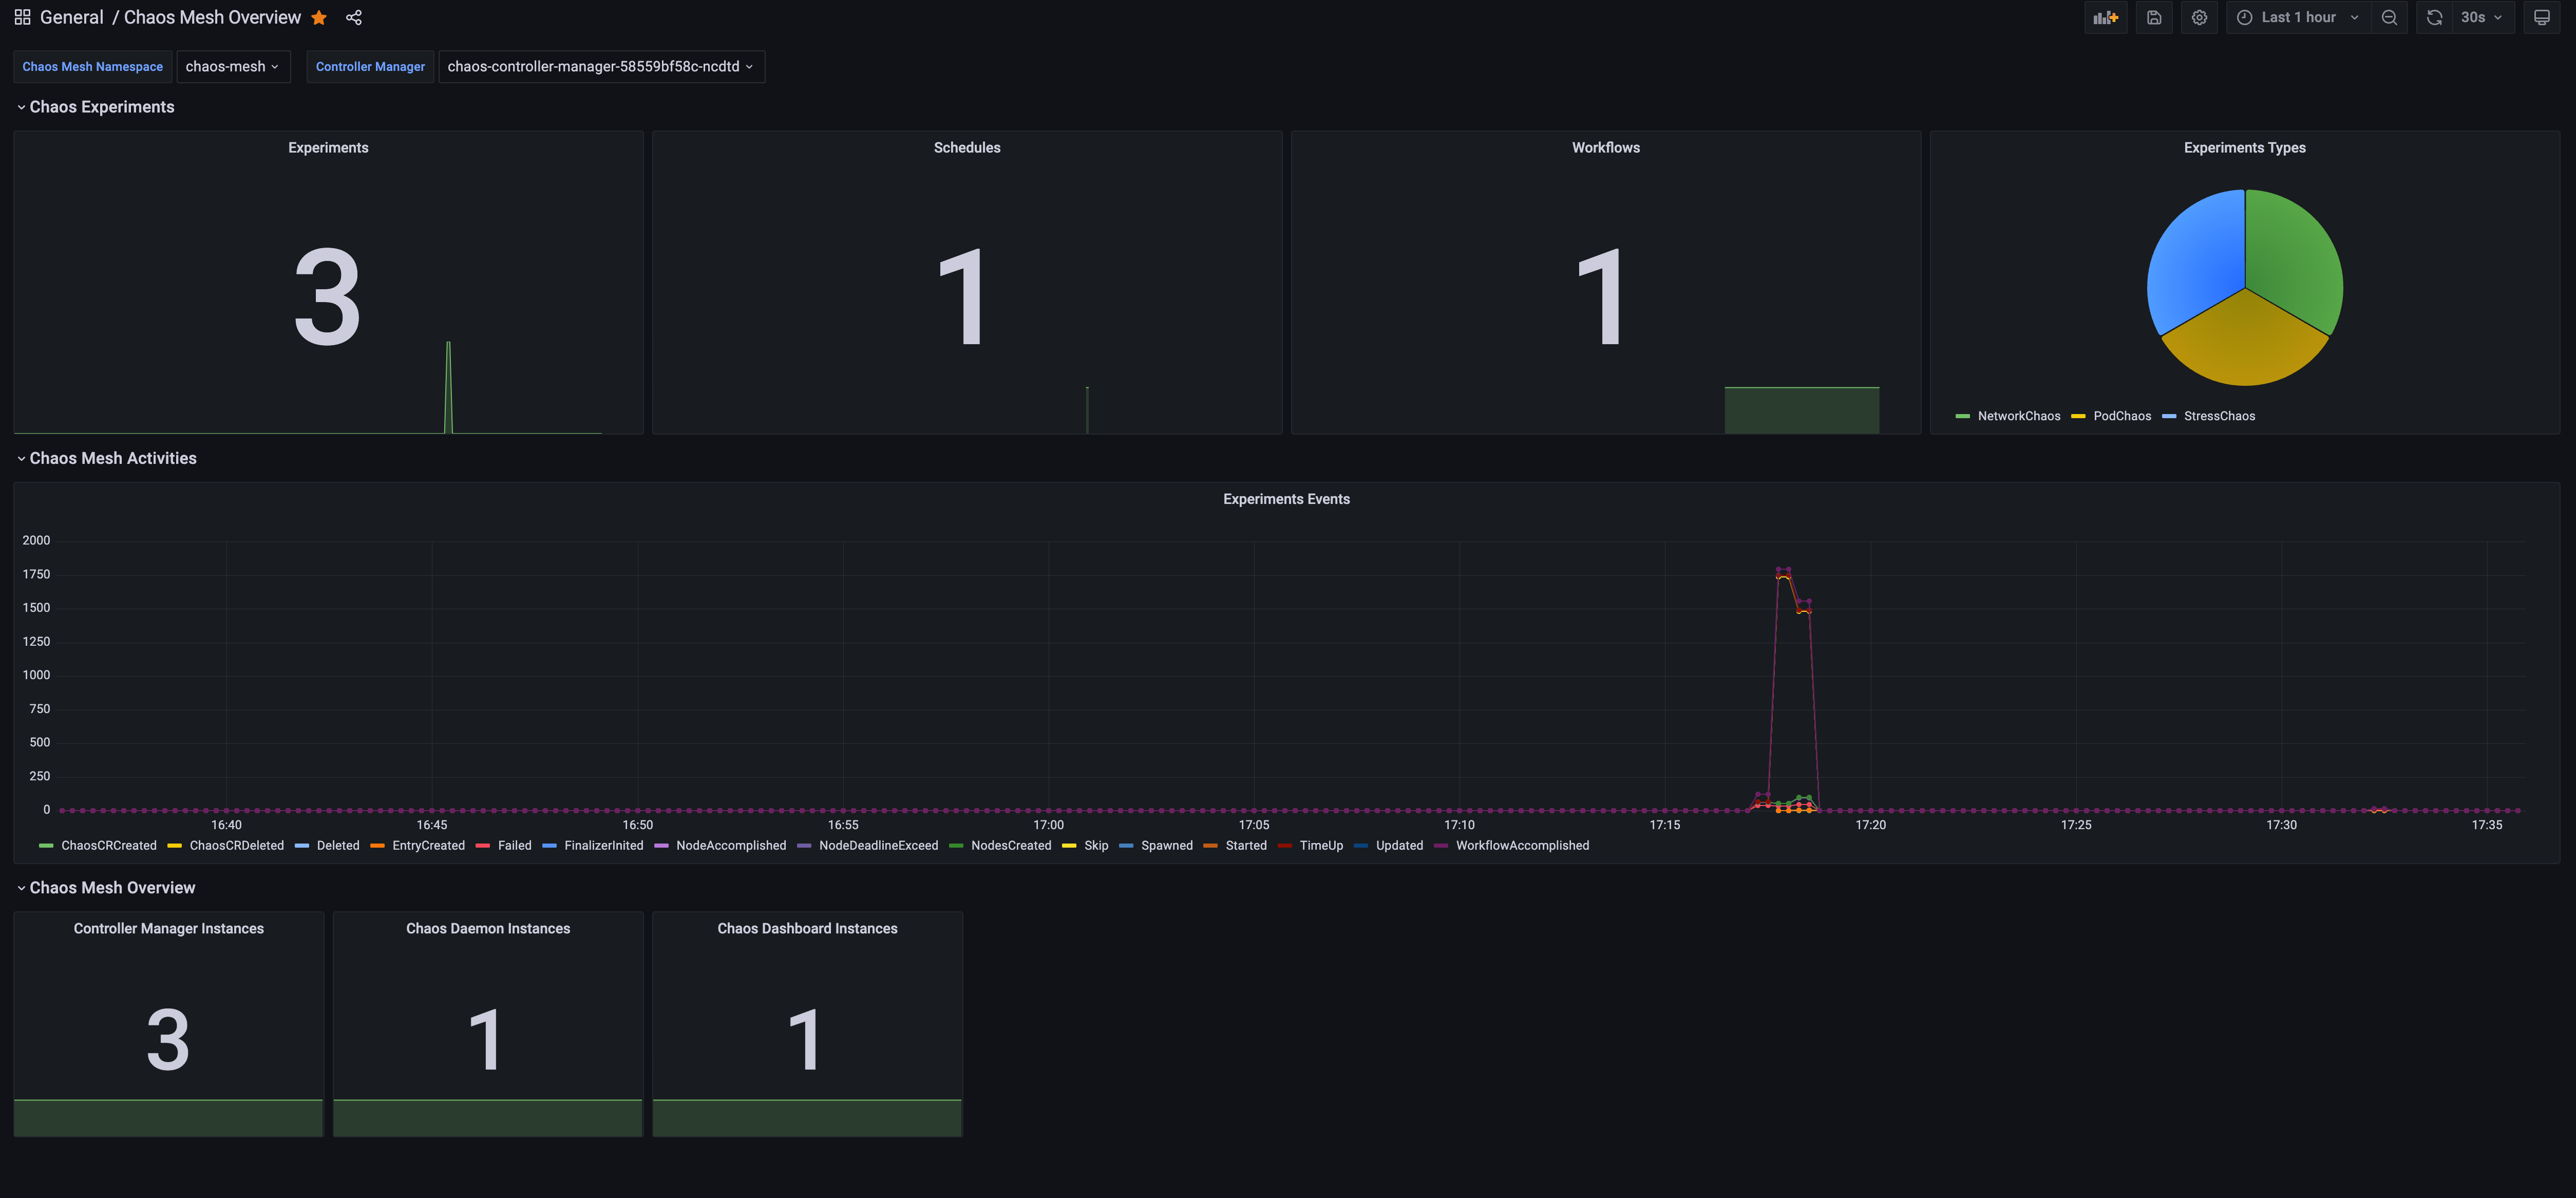
The Chaos Mesh Overview dashboard uses the prometheus data source to create a Grafana dashboard with the piechart, stat and timeseries panels.
Data source config
Collector type:
Collector plugins:
Collector config:
Revisions
Upload an updated version of an exported dashboard.json file from Grafana
| Revision | Description | Created | |
|---|---|---|---|
| Download |