
Kubernetes Cost Report
Kubernetes Cost Report detailed by
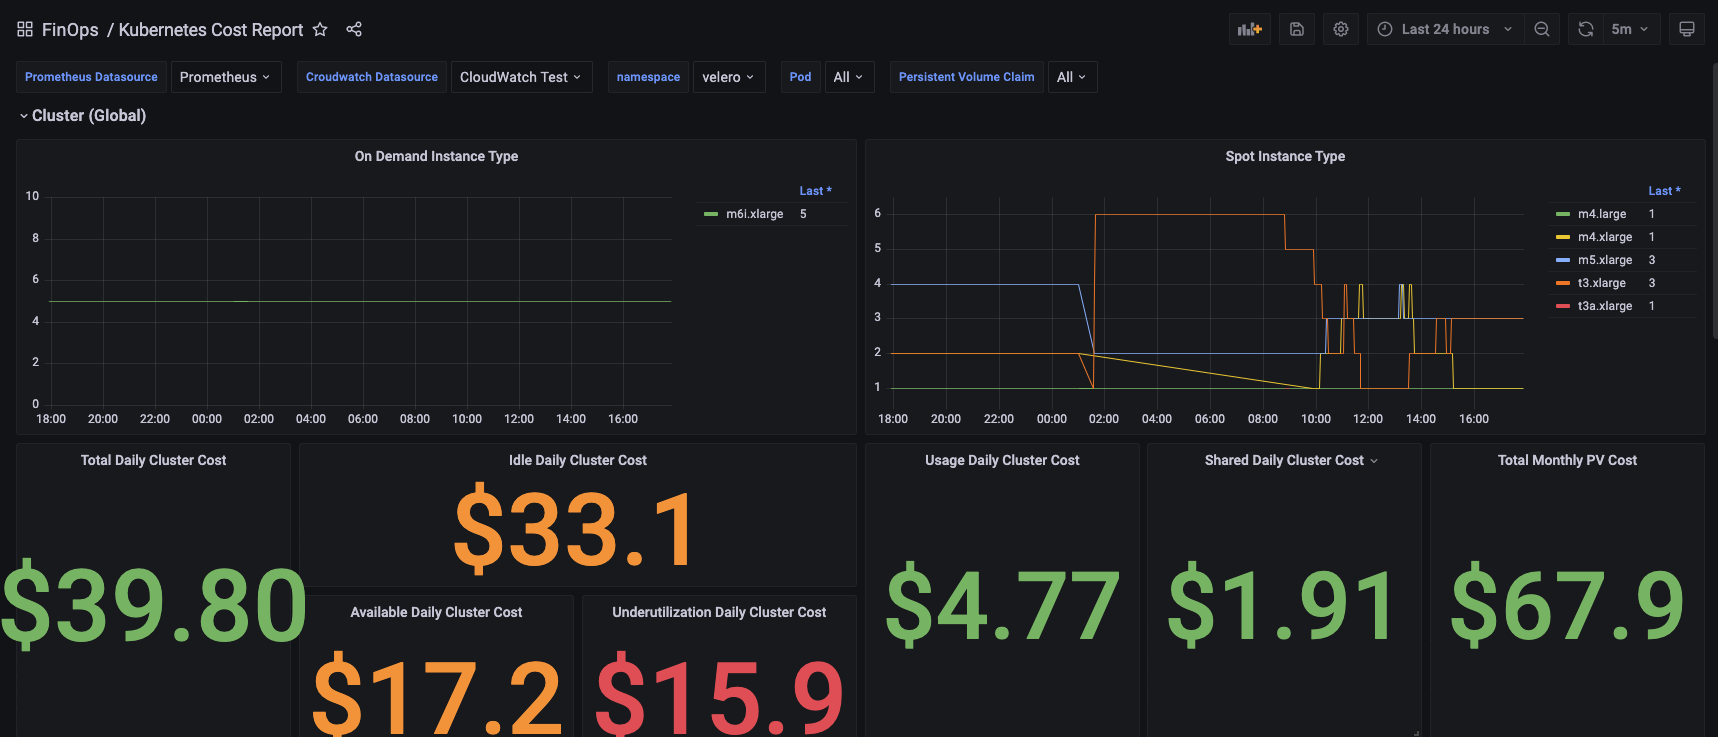
Cluster
OnDemand InstanceType
Spot InstanceType
Total Daily Cluster Cost (gauge) (timeseries per instance)
Idle Daily Cluster Cost (gauge)
Available Daily Cluster Cost (gauge)
Underutilization Daily Cluster Cost (gauge)
Usage Daily Cluster Cost (gauge)
Shared Daily Cluster Cost (gauge)
Total Monthly Persistent Volume Cost (gauge)
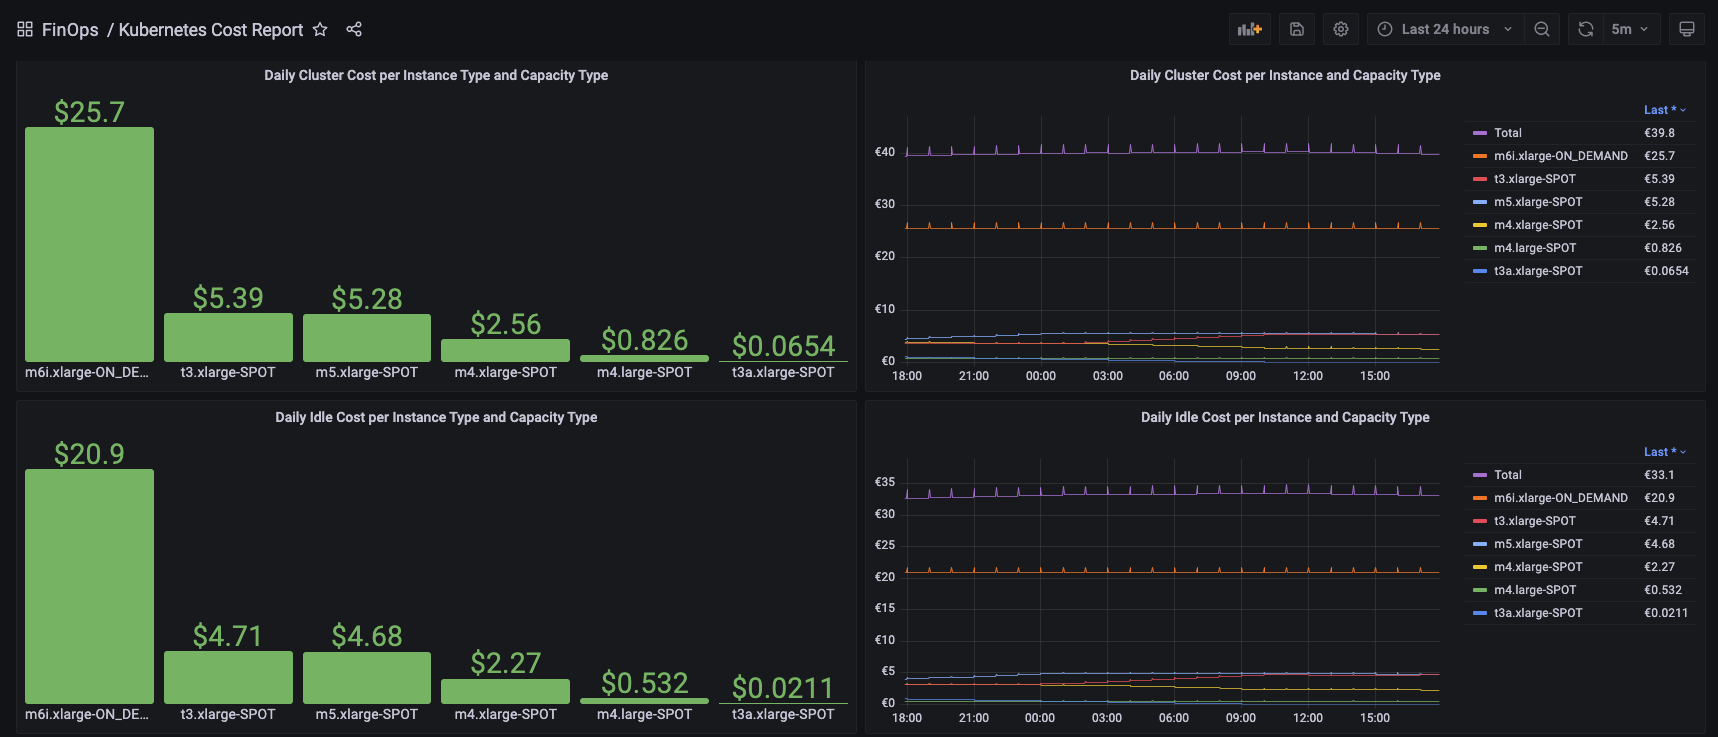
Daily Cluster Cost per Instance Type and Capacity Type (bar gauge)
Daily Cluster Cost per Instance Type and Capacity Type (graph)
Daily Idle Cost per Instance Type and Capacity Type (bar gauge)
Daily Idle Cost per Instance Type and Capacity Type (graph)
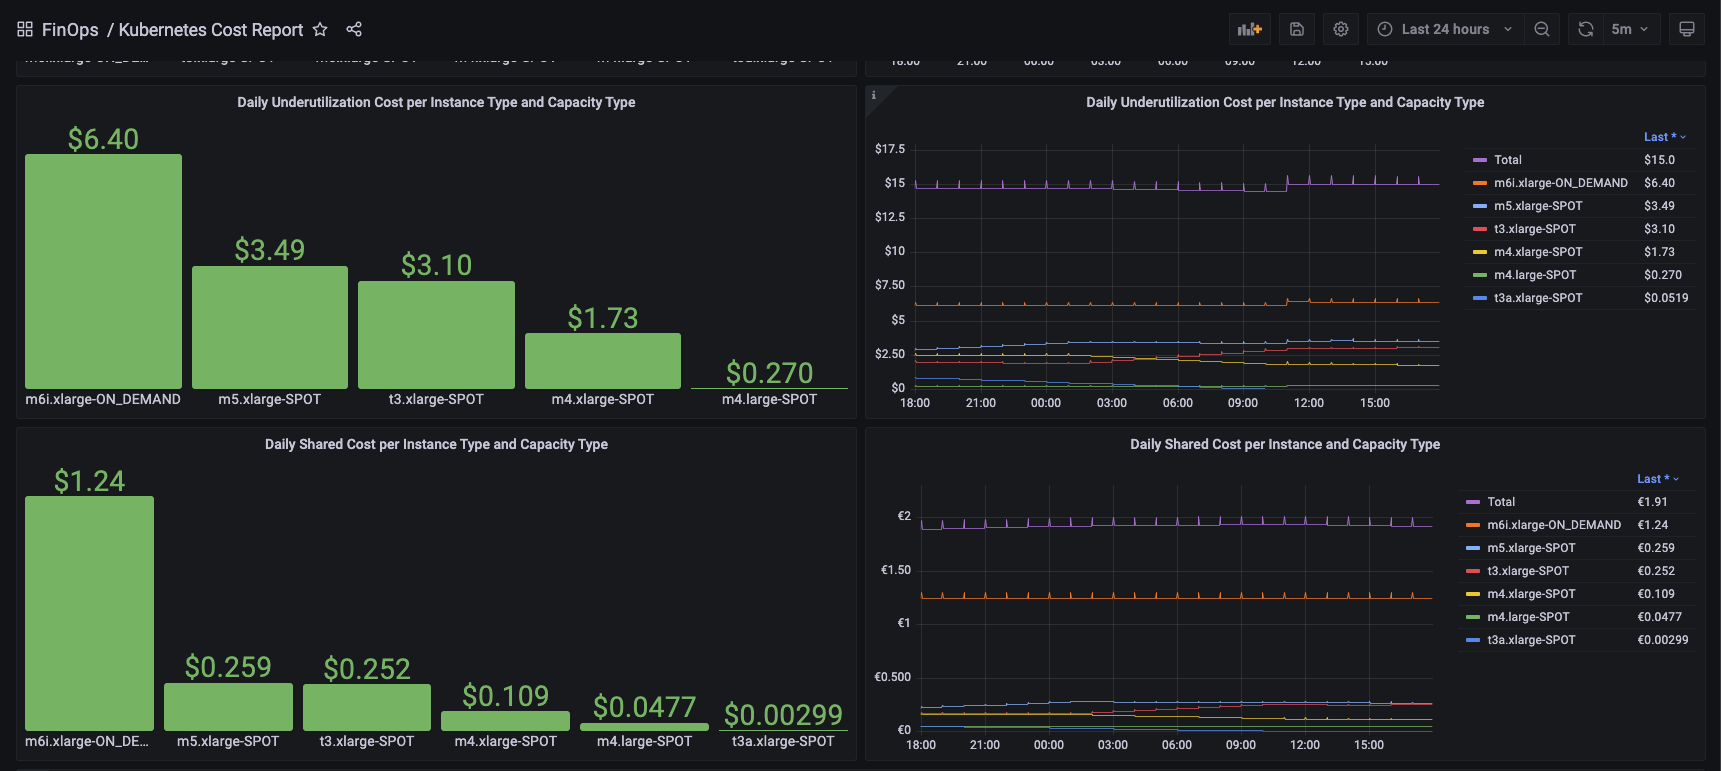
Daily Underutilization Cost per Instance Type and Capacity Type (bar gauge)
Daily Underutilization Cost per Instance Type and Capacity Type (graph)
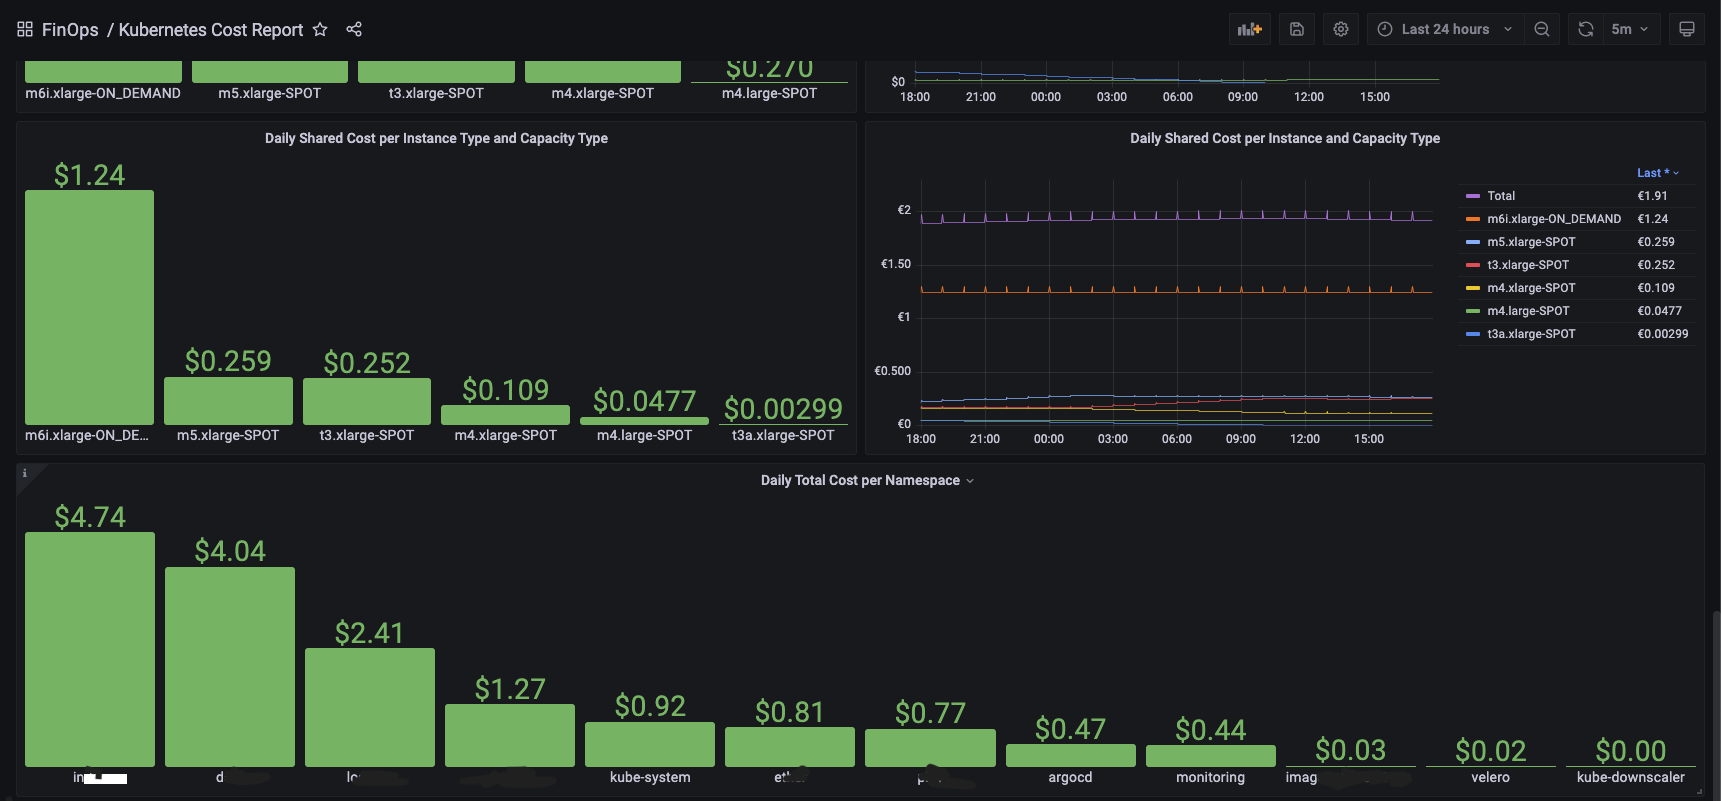
Daily Shared Cost per Instance Type and Capacity Type (bar gauge)
Daily Shared Cost per Instance Type and Capacity Type (graph)
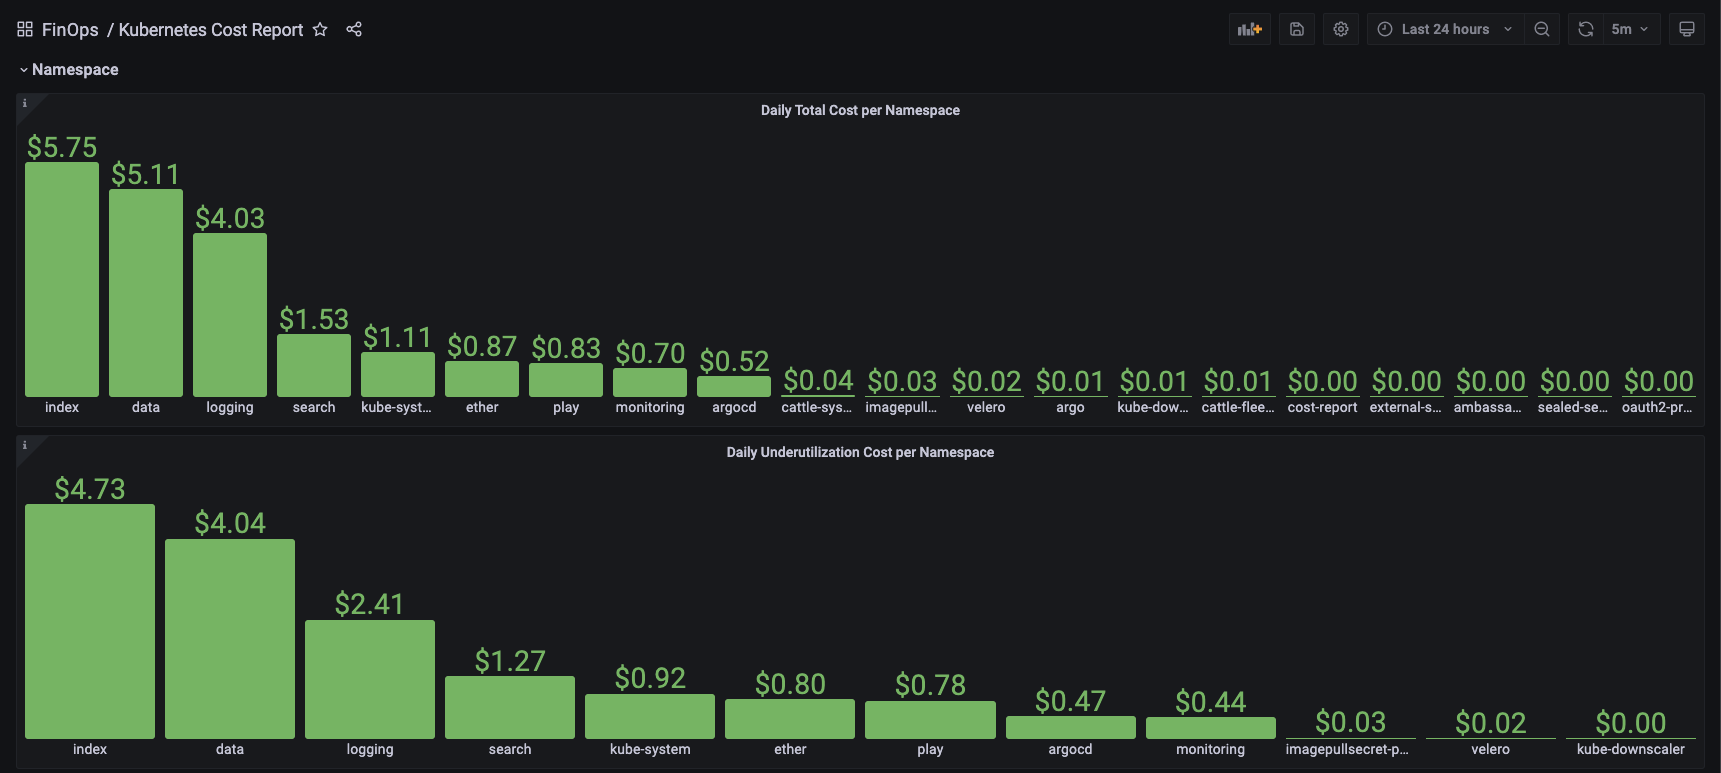
Namespace/Instance
Daily Underutilization Cost per Namespace Type (bar gauge)
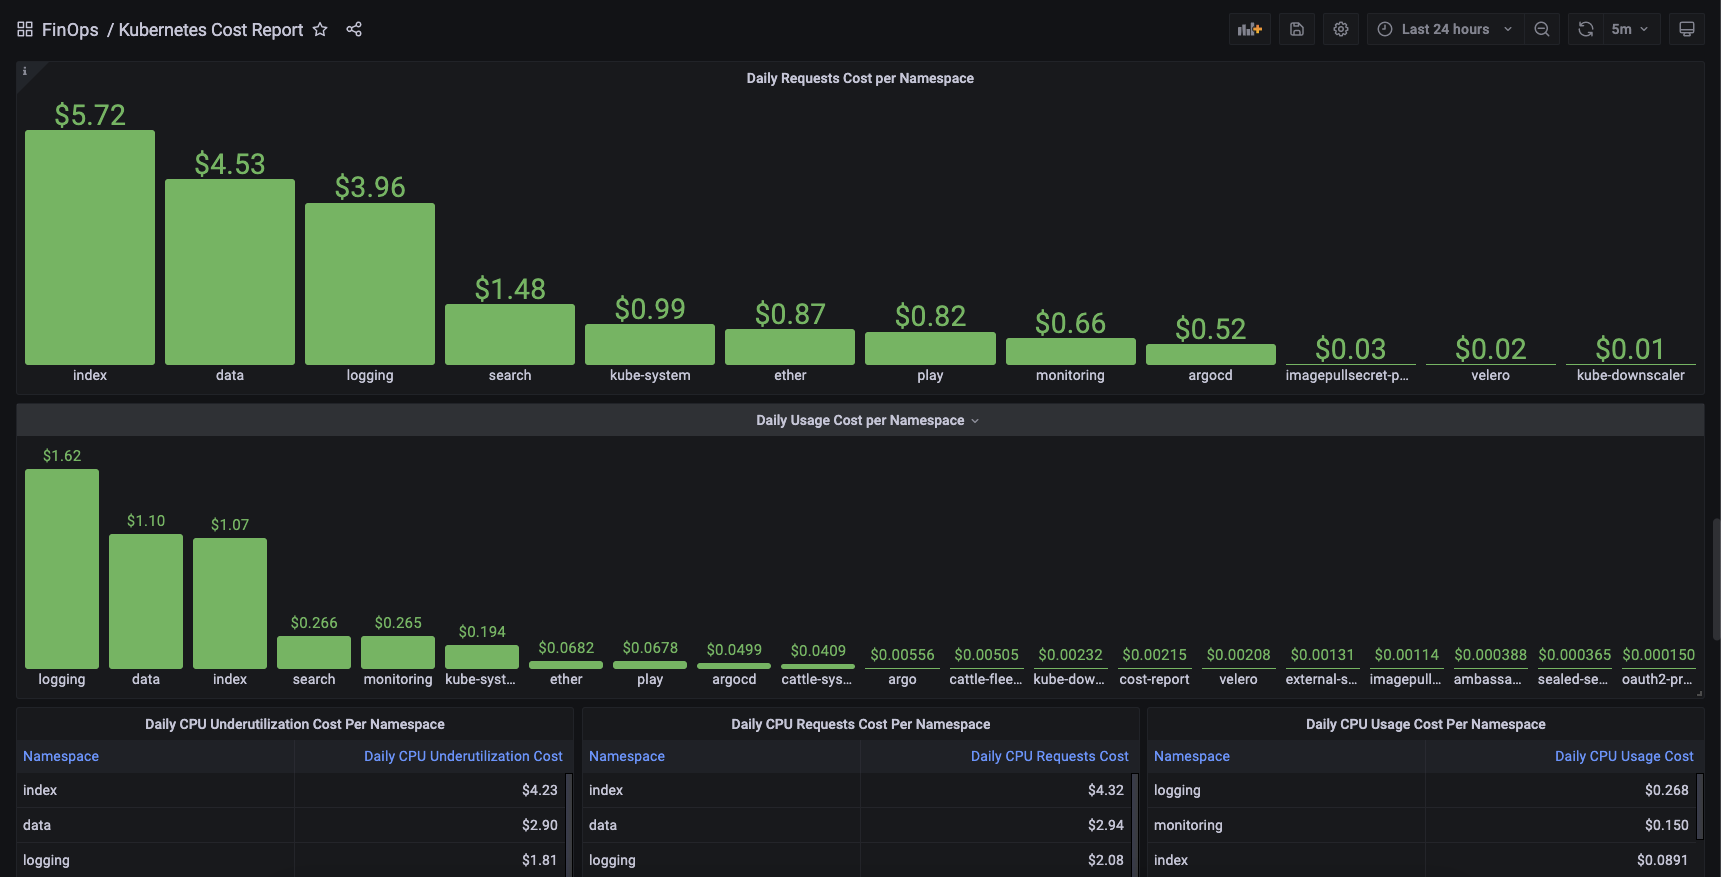
Daily Requests Cost per Namespace Type (bar gauge)
Daily Usage Cost per Namespace Type (bar gauge)
Daily CPU Underutilization Cost Per Namespace (table)
Daily CPU Requests Cost Per Namespace (table)
Daily CPU Usage Cost Per Namespace (table)
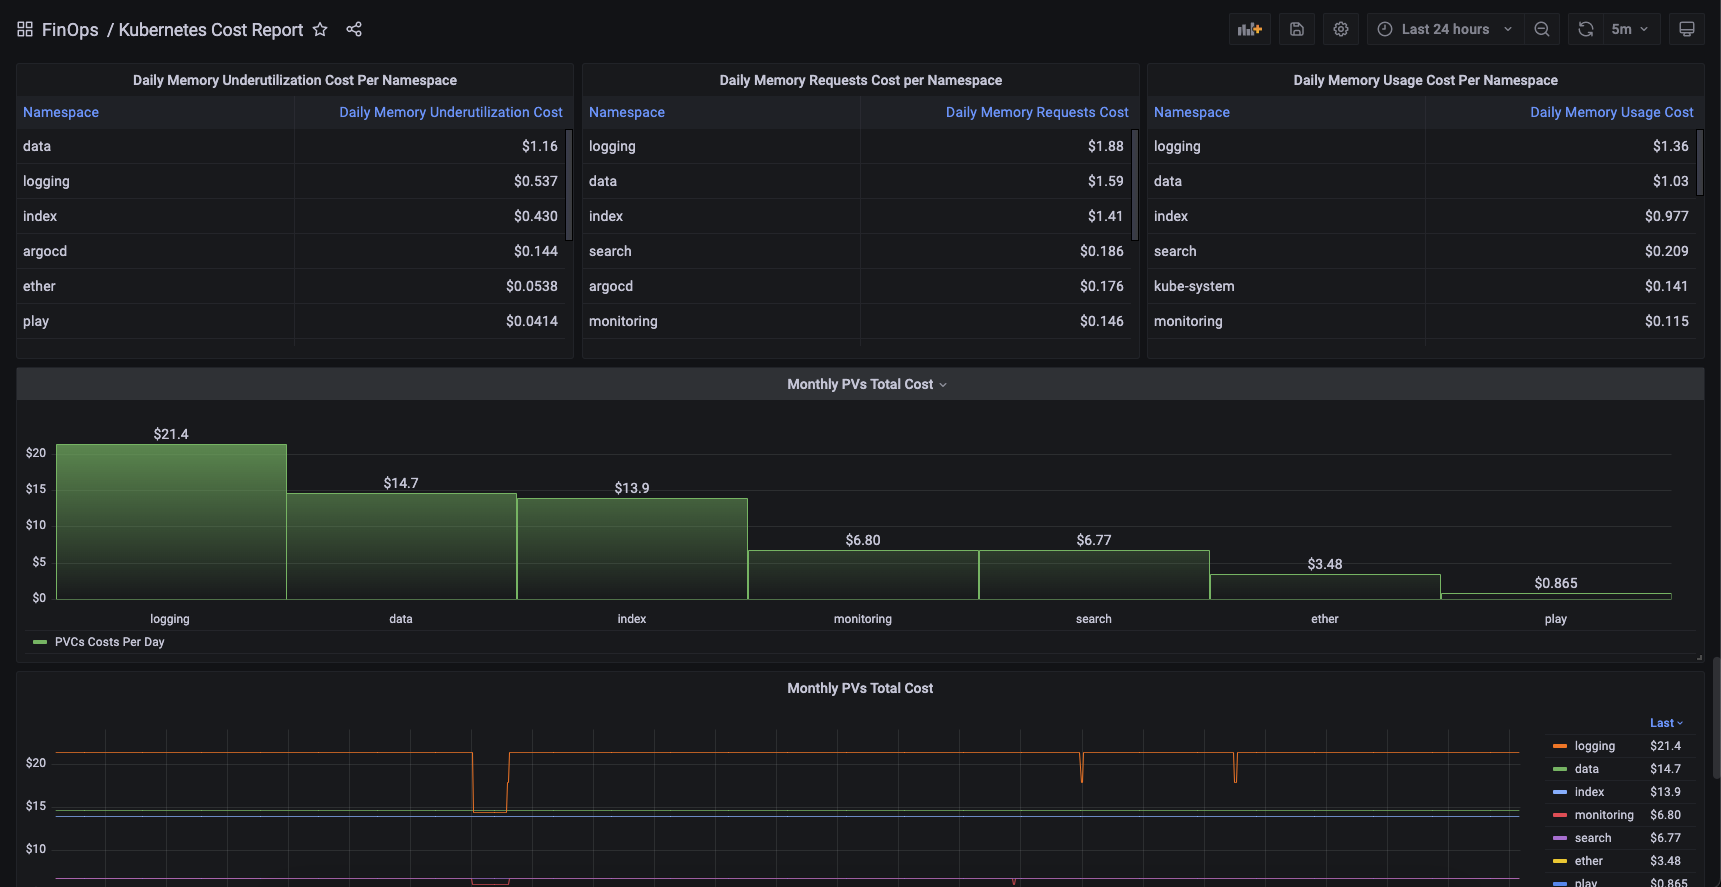
Daily Memory Underutilization Cost Per Namespace (table)
Daily Memory Requests Cost Per Namespace (table)
Daily Memory Usage Cost Per Namespace (table)
Monthly PV Cost Per Namespace (bar gauge)
Monthly PV Cost Per Namespace (graph)
Pod Per Namespace
Daily CPU Underutilization Costs Per Pod (table)
Daily CPU Requests Costs Per Pod (table)
Daily CPU Usage Costs Per Pod (table)
Daily Memory Underutilization Costs Per Pod (table)
Daily Memory Requests Costs Per Pod (table)
Daily Memory Usage Costs Per Pod (table)
CPU Requests vs Usage Per Pod (graph)
Memory Requests vs Usage Per Pod (graph)
Memory Usage Per Pod
Daily CPU Underutilization Costs Per Pod (graph)
Daily Memory Underutilization Costs Per Pod (graph)
Daily CPU Requests Costs Per Pod (graph)
Daily Memory Requests Costs Per Pod (graph)
Daily CPU Usage Costs Per Pod (graph)
Daily Memory Usage Costs Per Pod (graph)
Monthly PV Cost Per Pod
Data source config
Collector config:
Dashboard revisions
Upload an updated version of an exported dashboard.json file from Grafana
| Revision | Decscription | Created | |
|---|---|---|---|
| Download |
Get this dashboard
Data source:
Dependencies: