App Metrics - Web Monitoring - Prometheus
Dashboard to visualize metrics captured by App Metrics ASP.NET Core Middleware 4.3.0, tested with App.Metrics.Formatters.Prometheus 4.3.0 - https://www.app-metrics.io/
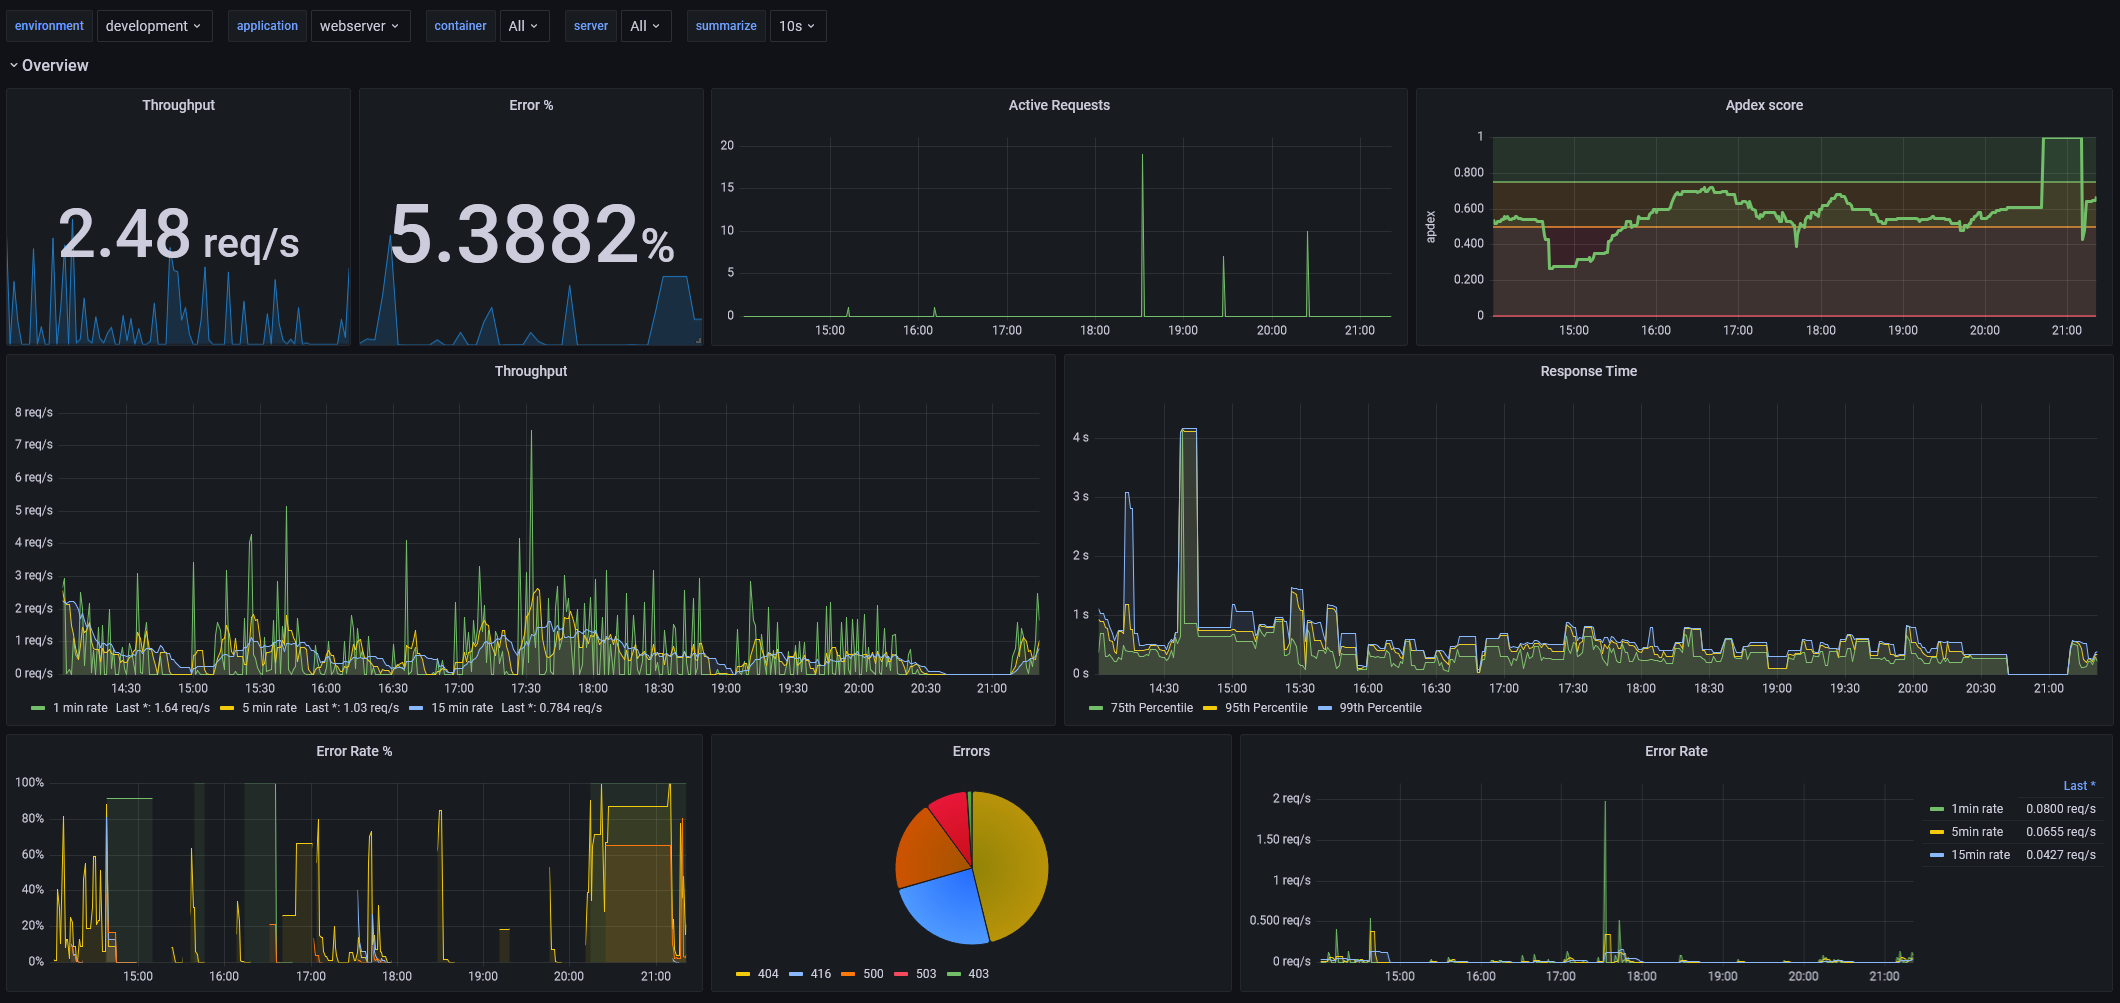
This dashboard is a fixed and updated version of the 2204 dashboard. It is for use with the default metrics captured by App Metric's ASP.NET Core Middleware and the App Metrics Prometheus reporter.
See the documentation for more details on Prometheus reporter and the main GitHub repository
Changes:
- removed references to InfluxDb
- replaced usage of Pie Chart plugin with the newly integrated Pie Chart
- replaced old panels with new variants
- fixed filtering for server
- added additional variable container which is useful in kubernetes environment to differentiate pods using the same image, but with a different container
- chained all variables to show only relevant values
- all data is grouped by shown labels which is useful in kubernetes environment where pods get restarted/replaced
Data source config
Collector type:
Collector plugins:
Collector config:
Revisions
Upload an updated version of an exported dashboard.json file from Grafana
| Revision | Description | Created | |
|---|---|---|---|
| Download |
Metrics Endpoint (Prometheus)
Easily monitor any Prometheus-compatible and publicly accessible metrics URL with Grafana Cloud's out-of-the-box monitoring solution.
Learn more