
k6 Load Testing Results
A dashboard for visualizing results from the k6.io load testing tool, using the InfluxDB exporter
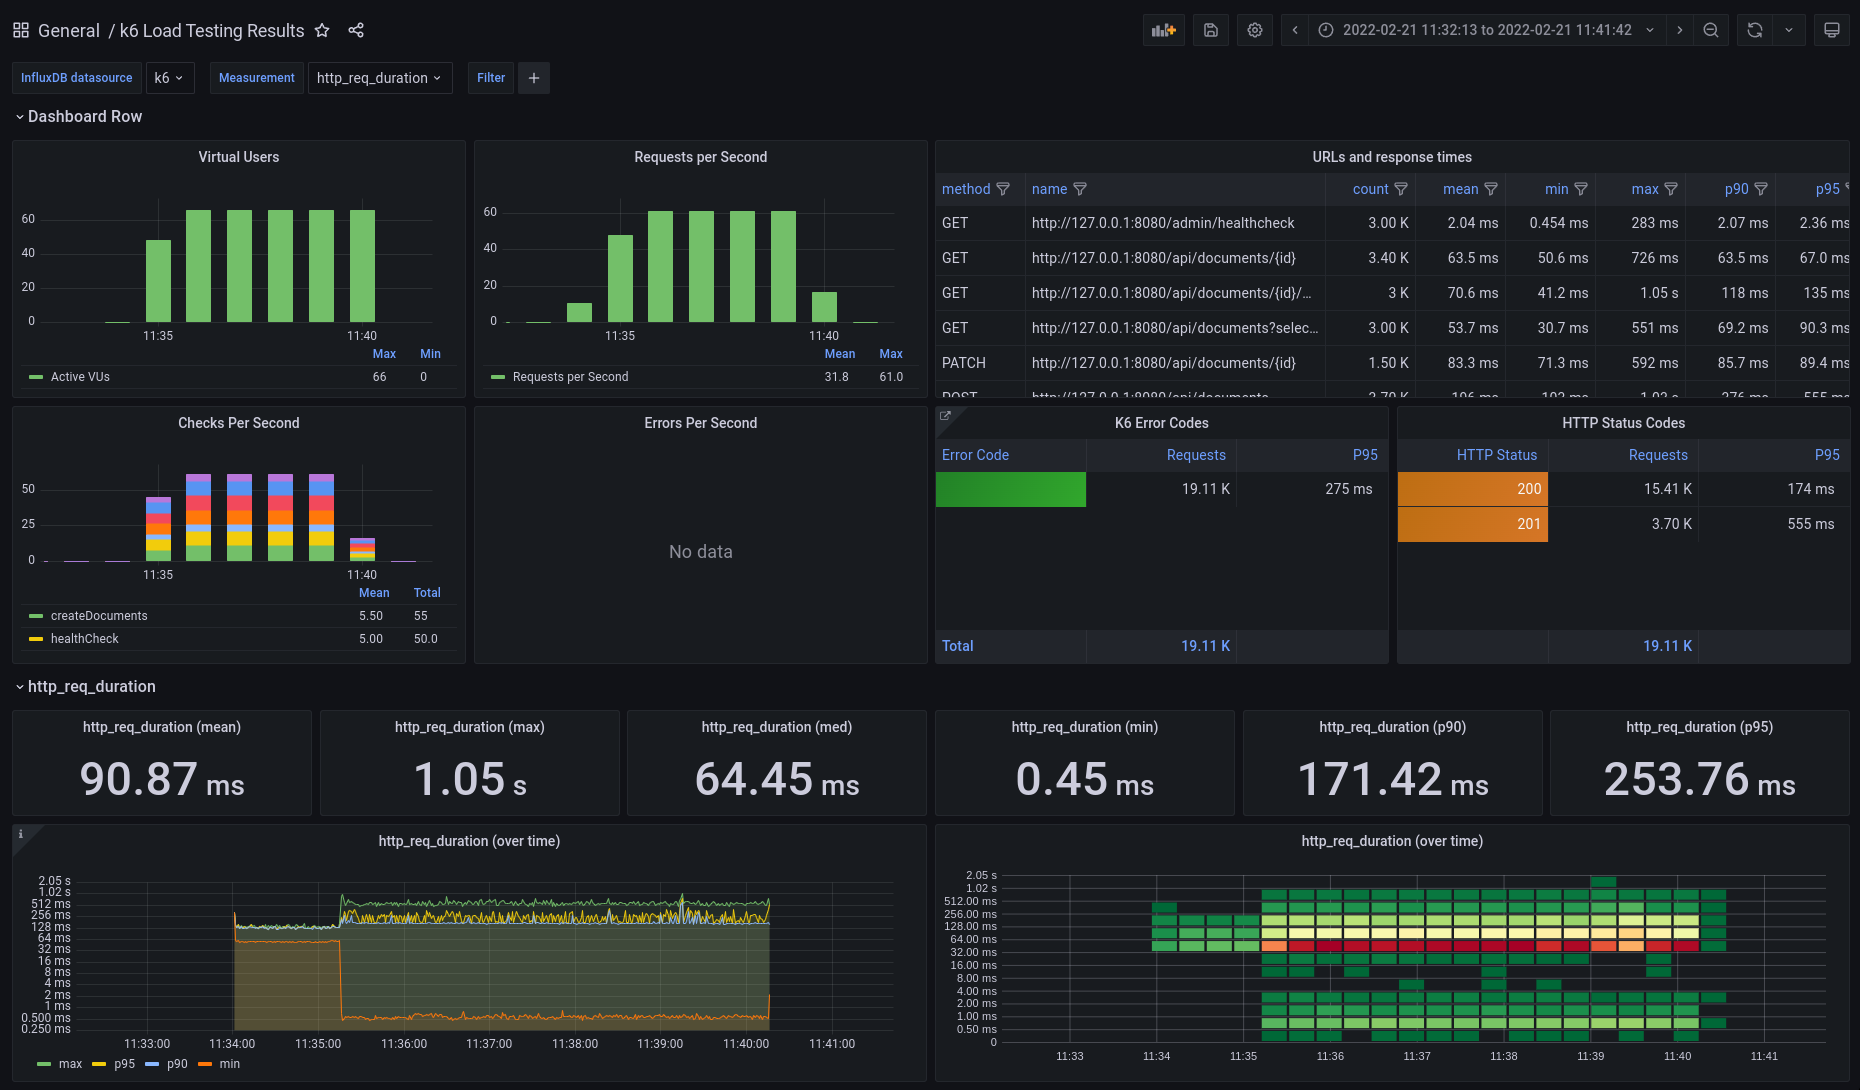
A dashboard for k6 load-test results, roughly based on https://grafana.com/grafana/dashboards/2587
Additional features:
- Table with metrics per endpoint (“name”)
- count, mean, min, max, p90, p95
- Column filters
- Using latest Grafana panels (as of Grafana 8.4.1)
- Add datasource selector
- Add adhoc filter
- Per second metrics group data per one minute
Logo taken from: https://commons.wikimedia.org/wiki/File:K6-logo.svg
Data source config
Collector type:
Collector plugins:
Collector config:
Dashboard revisions
Upload an updated version of an exported dashboard.json file from Grafana
| Revision | Decscription | Created | |
|---|---|---|---|
| Download |
Sign up for Grafana Cloud

Get up and running in minutes with the Grafana Cloud free tier, which includes free forever 10k metrics, 50GB logs, 50GB traces, 500 VUh, and more.
Get this dashboard
Data source:
Dependencies: