
k6 Load Testing Results
A dashboard for visualizing results from the k6.io load testing tool, using the InfluxDB exporter
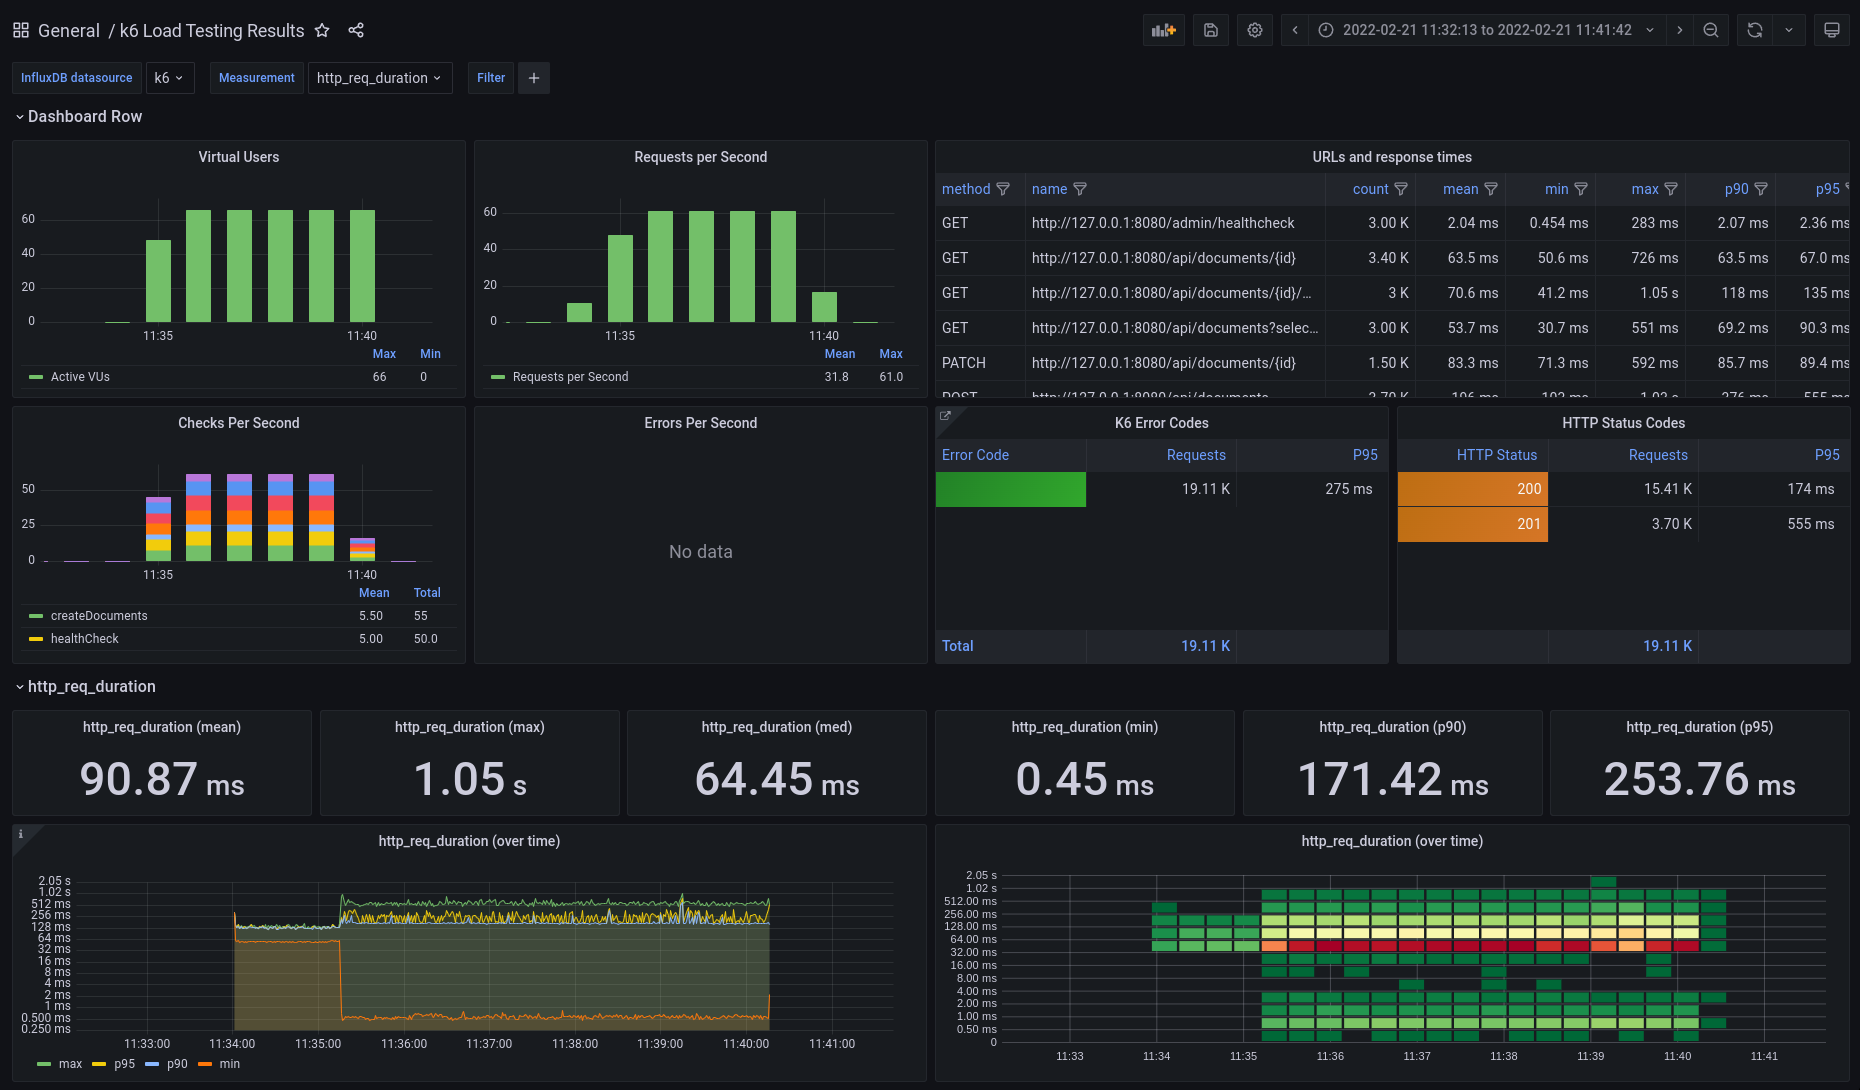
A dashboard for k6 load-test results, roughly based on https://grafana.com/grafana/dashboards/2587
Additional features:
- Table with metrics per endpoint (“name”)
- count, mean, min, max, p90, p95
- Column filters
- Using latest Grafana panels (as of Grafana 8.4.1)
- Add datasource selector
- Add adhoc filter
- Per second metrics group data per one minute
Logo taken from: https://commons.wikimedia.org/wiki/File:K6-logo.svg
Data source config
Collector type:
Collector plugins:
Collector config:
Revisions
Upload an updated version of an exported dashboard.json file from Grafana
| Revision | Description | Created | |
|---|---|---|---|
| Download |
Get this dashboard
Resources