Opstree/Node Exporter
Grafana Dashboard for Host Level Metrics using Node Exporter
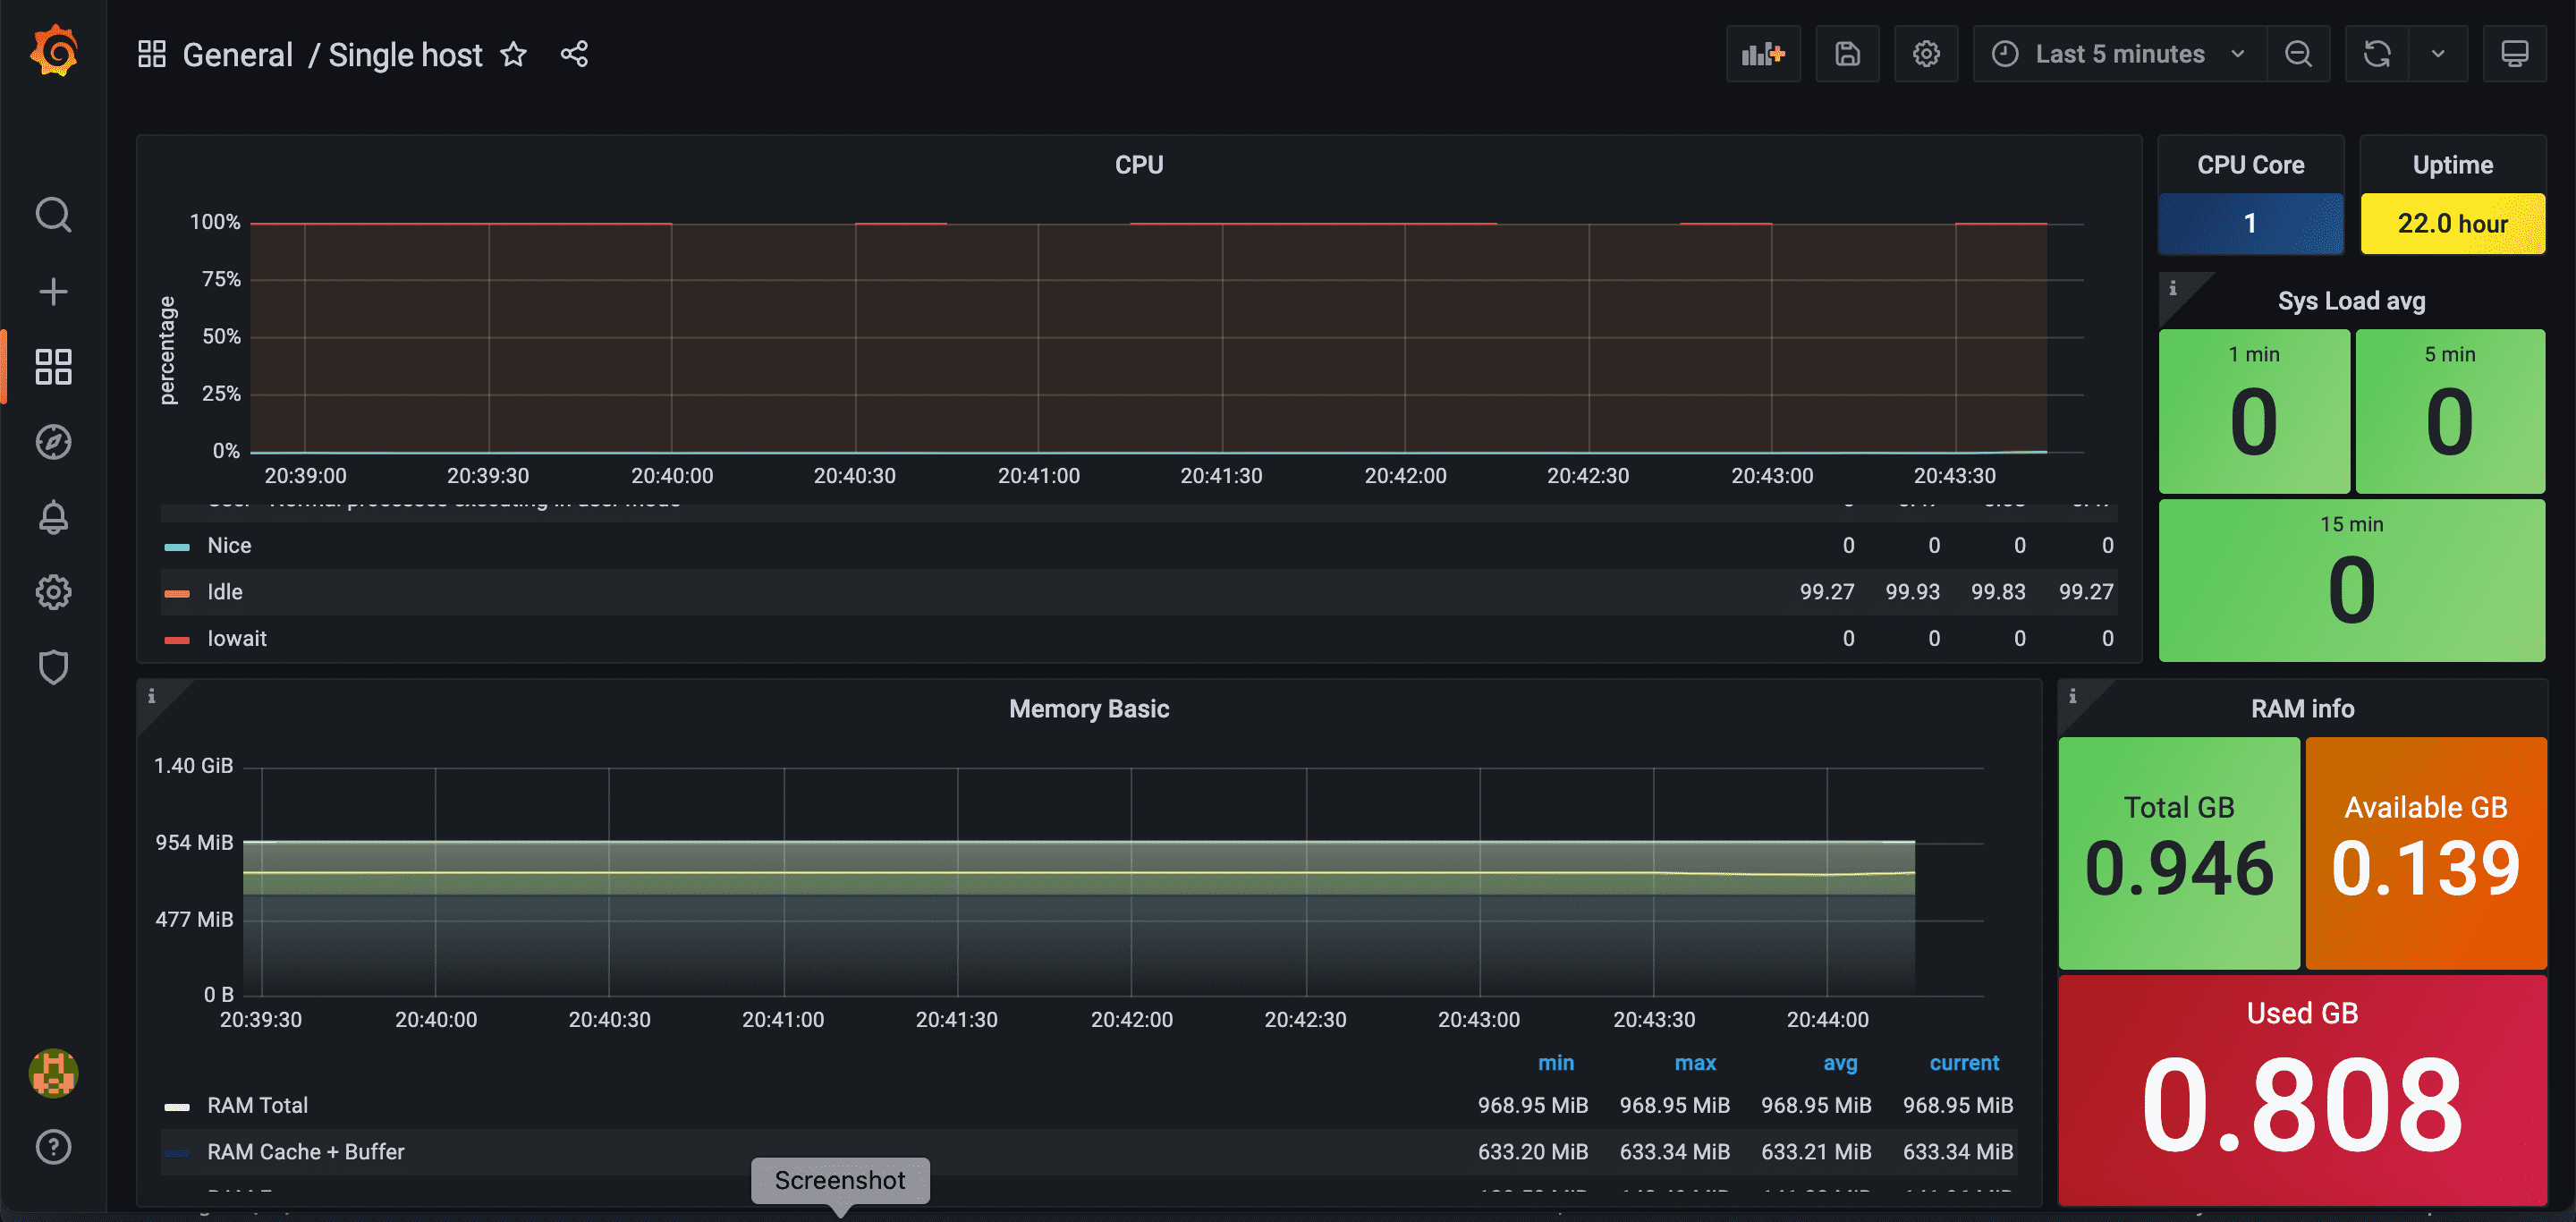
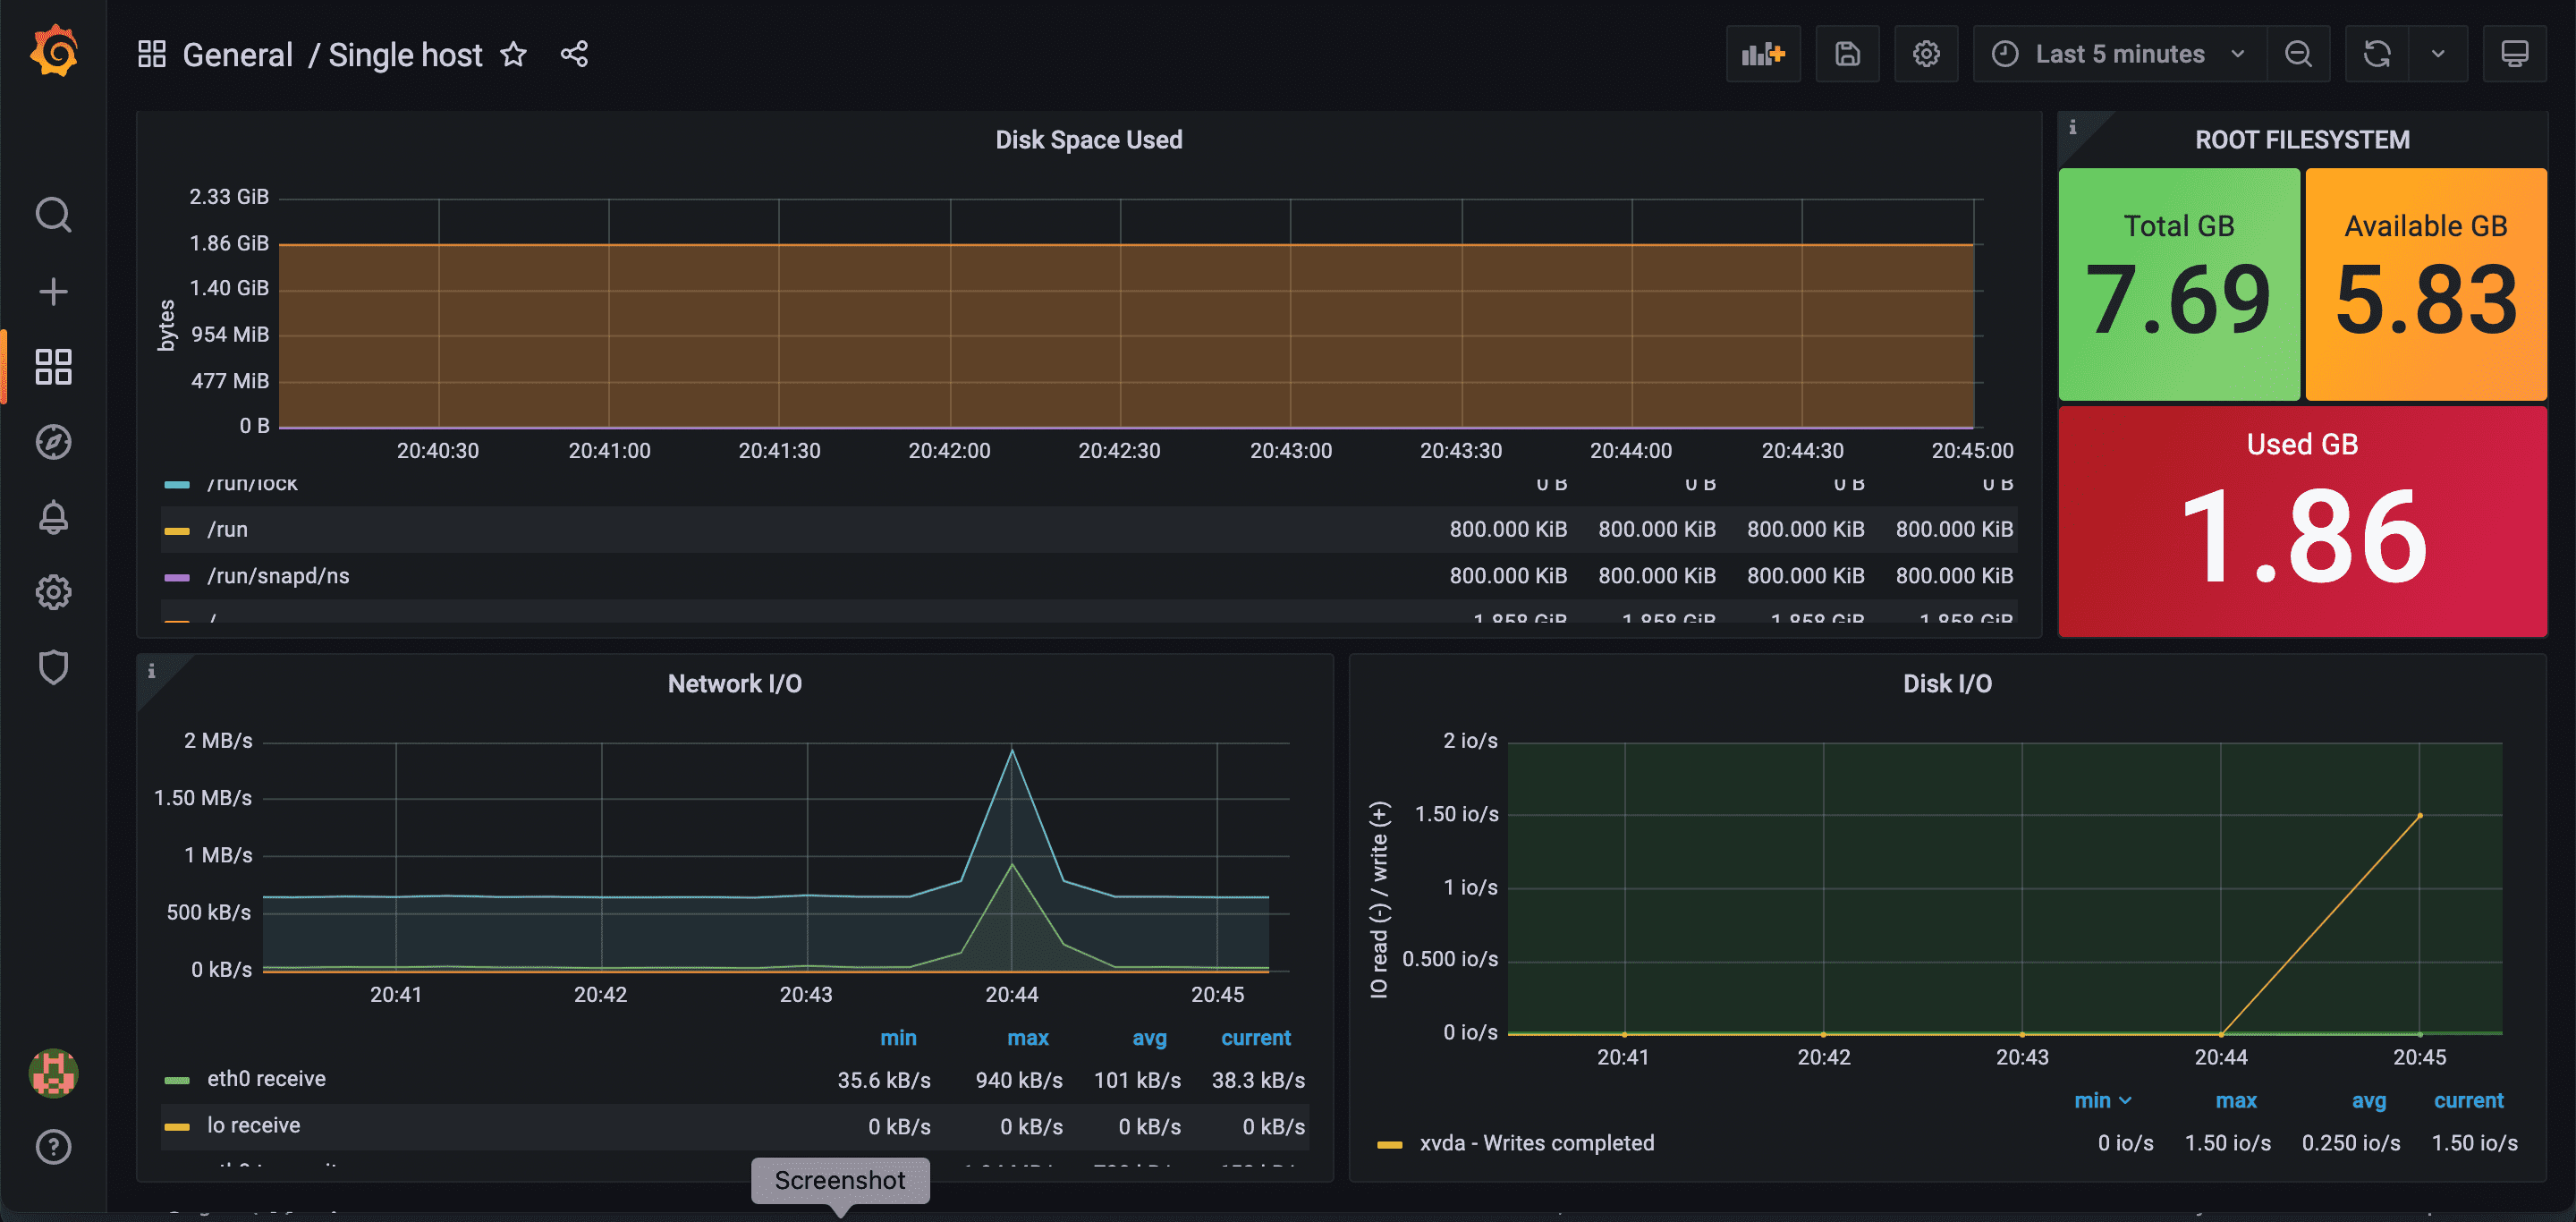
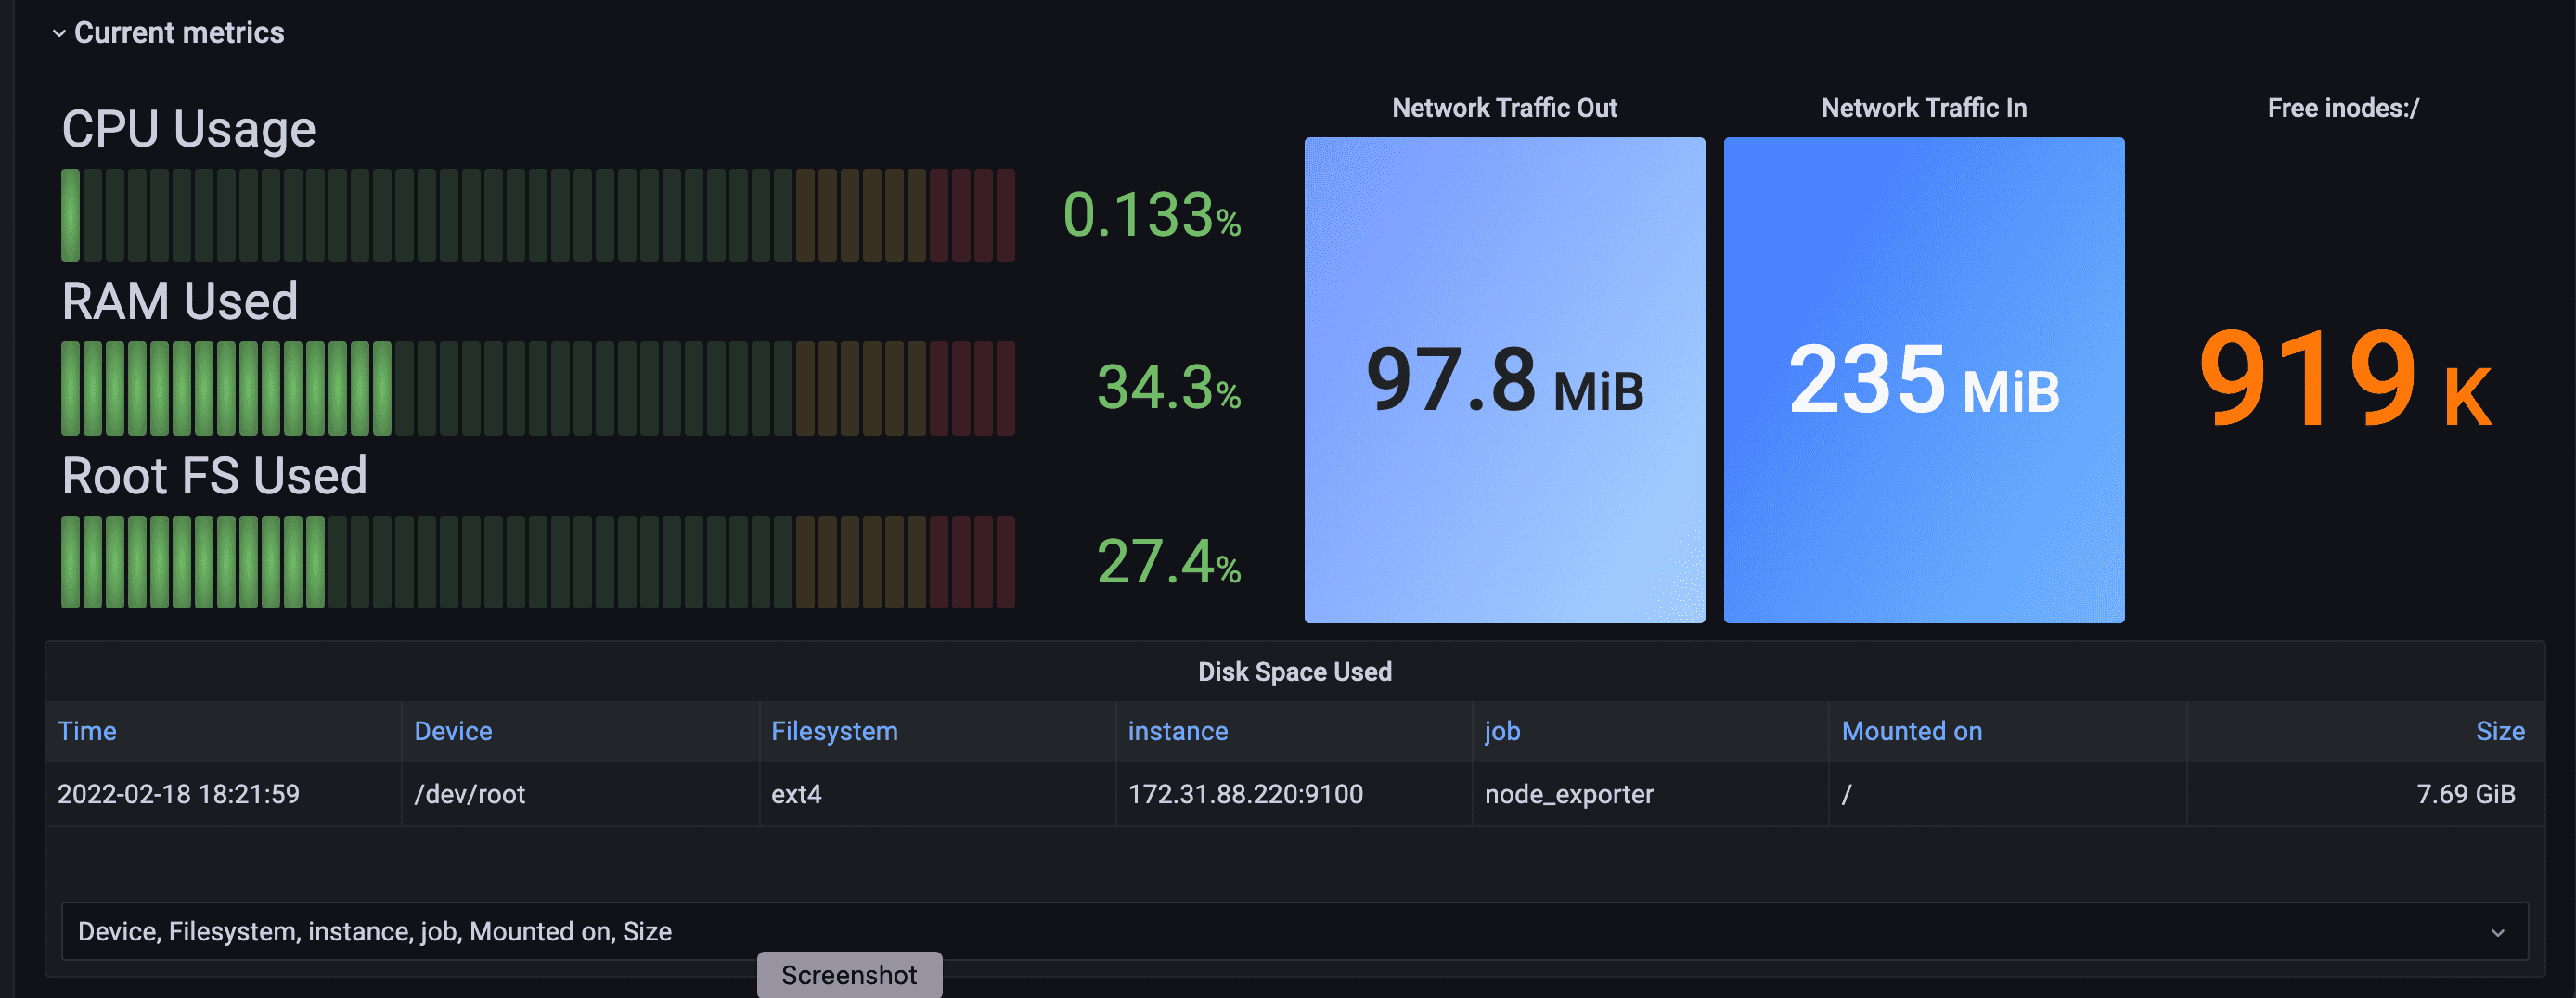
Metrics of Dashboards
- CPU Graph
- CPU Core
- Uptime
- System Load Avg.
- Memory Basic
- RAM info (Total, Available RAM, Used RAM)
- Disk Space Used
- Root File System in GB (Total, Available, Used)
- Network I/O
- Disk I/O
- Free inodes
Contributor Information
Data source config
Collector type:
Collector plugins:
Collector config:
Revisions
Upload an updated version of an exported dashboard.json file from Grafana
| Revision | Description | Created | |
|---|---|---|---|
| Download |