Geth Node Dashboard (Feb. 2022)
A dashboard compatible with the Go Ethereum built in Prometheus metrics as of Feb 2022 (Faryar (v1.10.15))
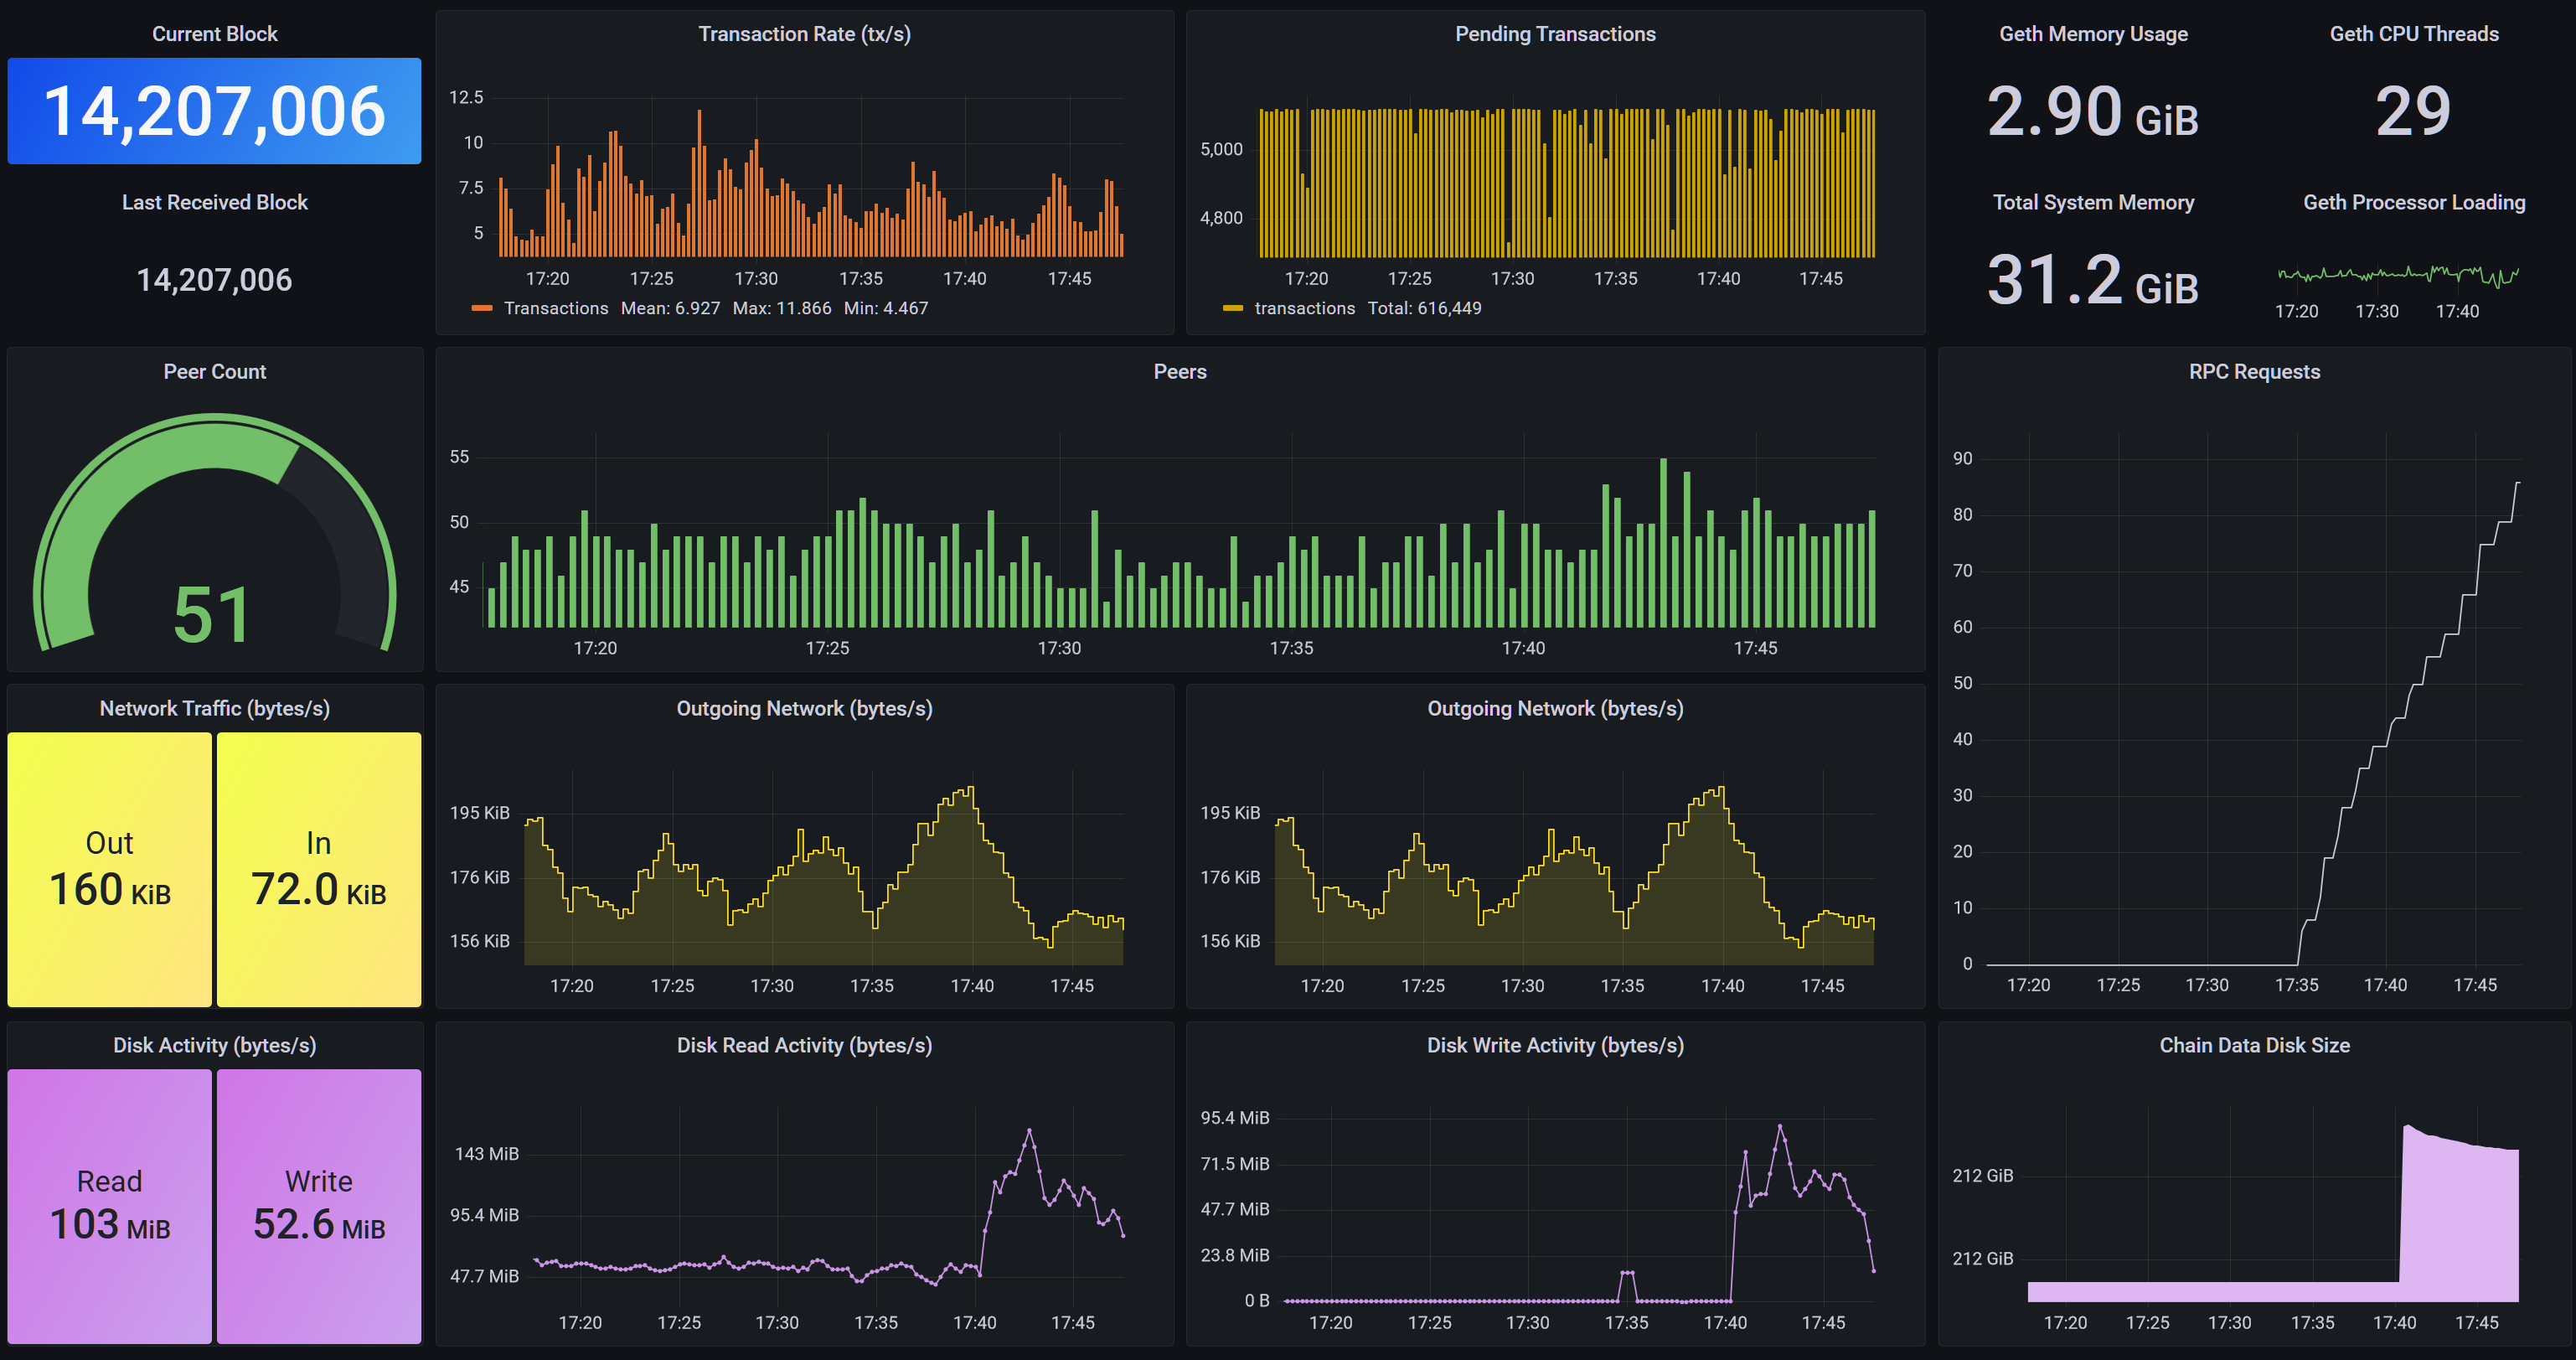
The Geth Node Dashboard (Feb. 2022) dashboard uses the prometheus data source to create a Grafana dashboard with the gauge, stat and timeseries panels.
Data source config
Collector type:
Collector plugins:
Collector config:
Revisions
Upload an updated version of an exported dashboard.json file from Grafana
| Revision | Description | Created | |
|---|---|---|---|
| Download |
Linux Server
Monitor Linux with Grafana. Easily monitor your Linux deployment with Grafana Cloud's out-of-the-box monitoring solution.
Learn more