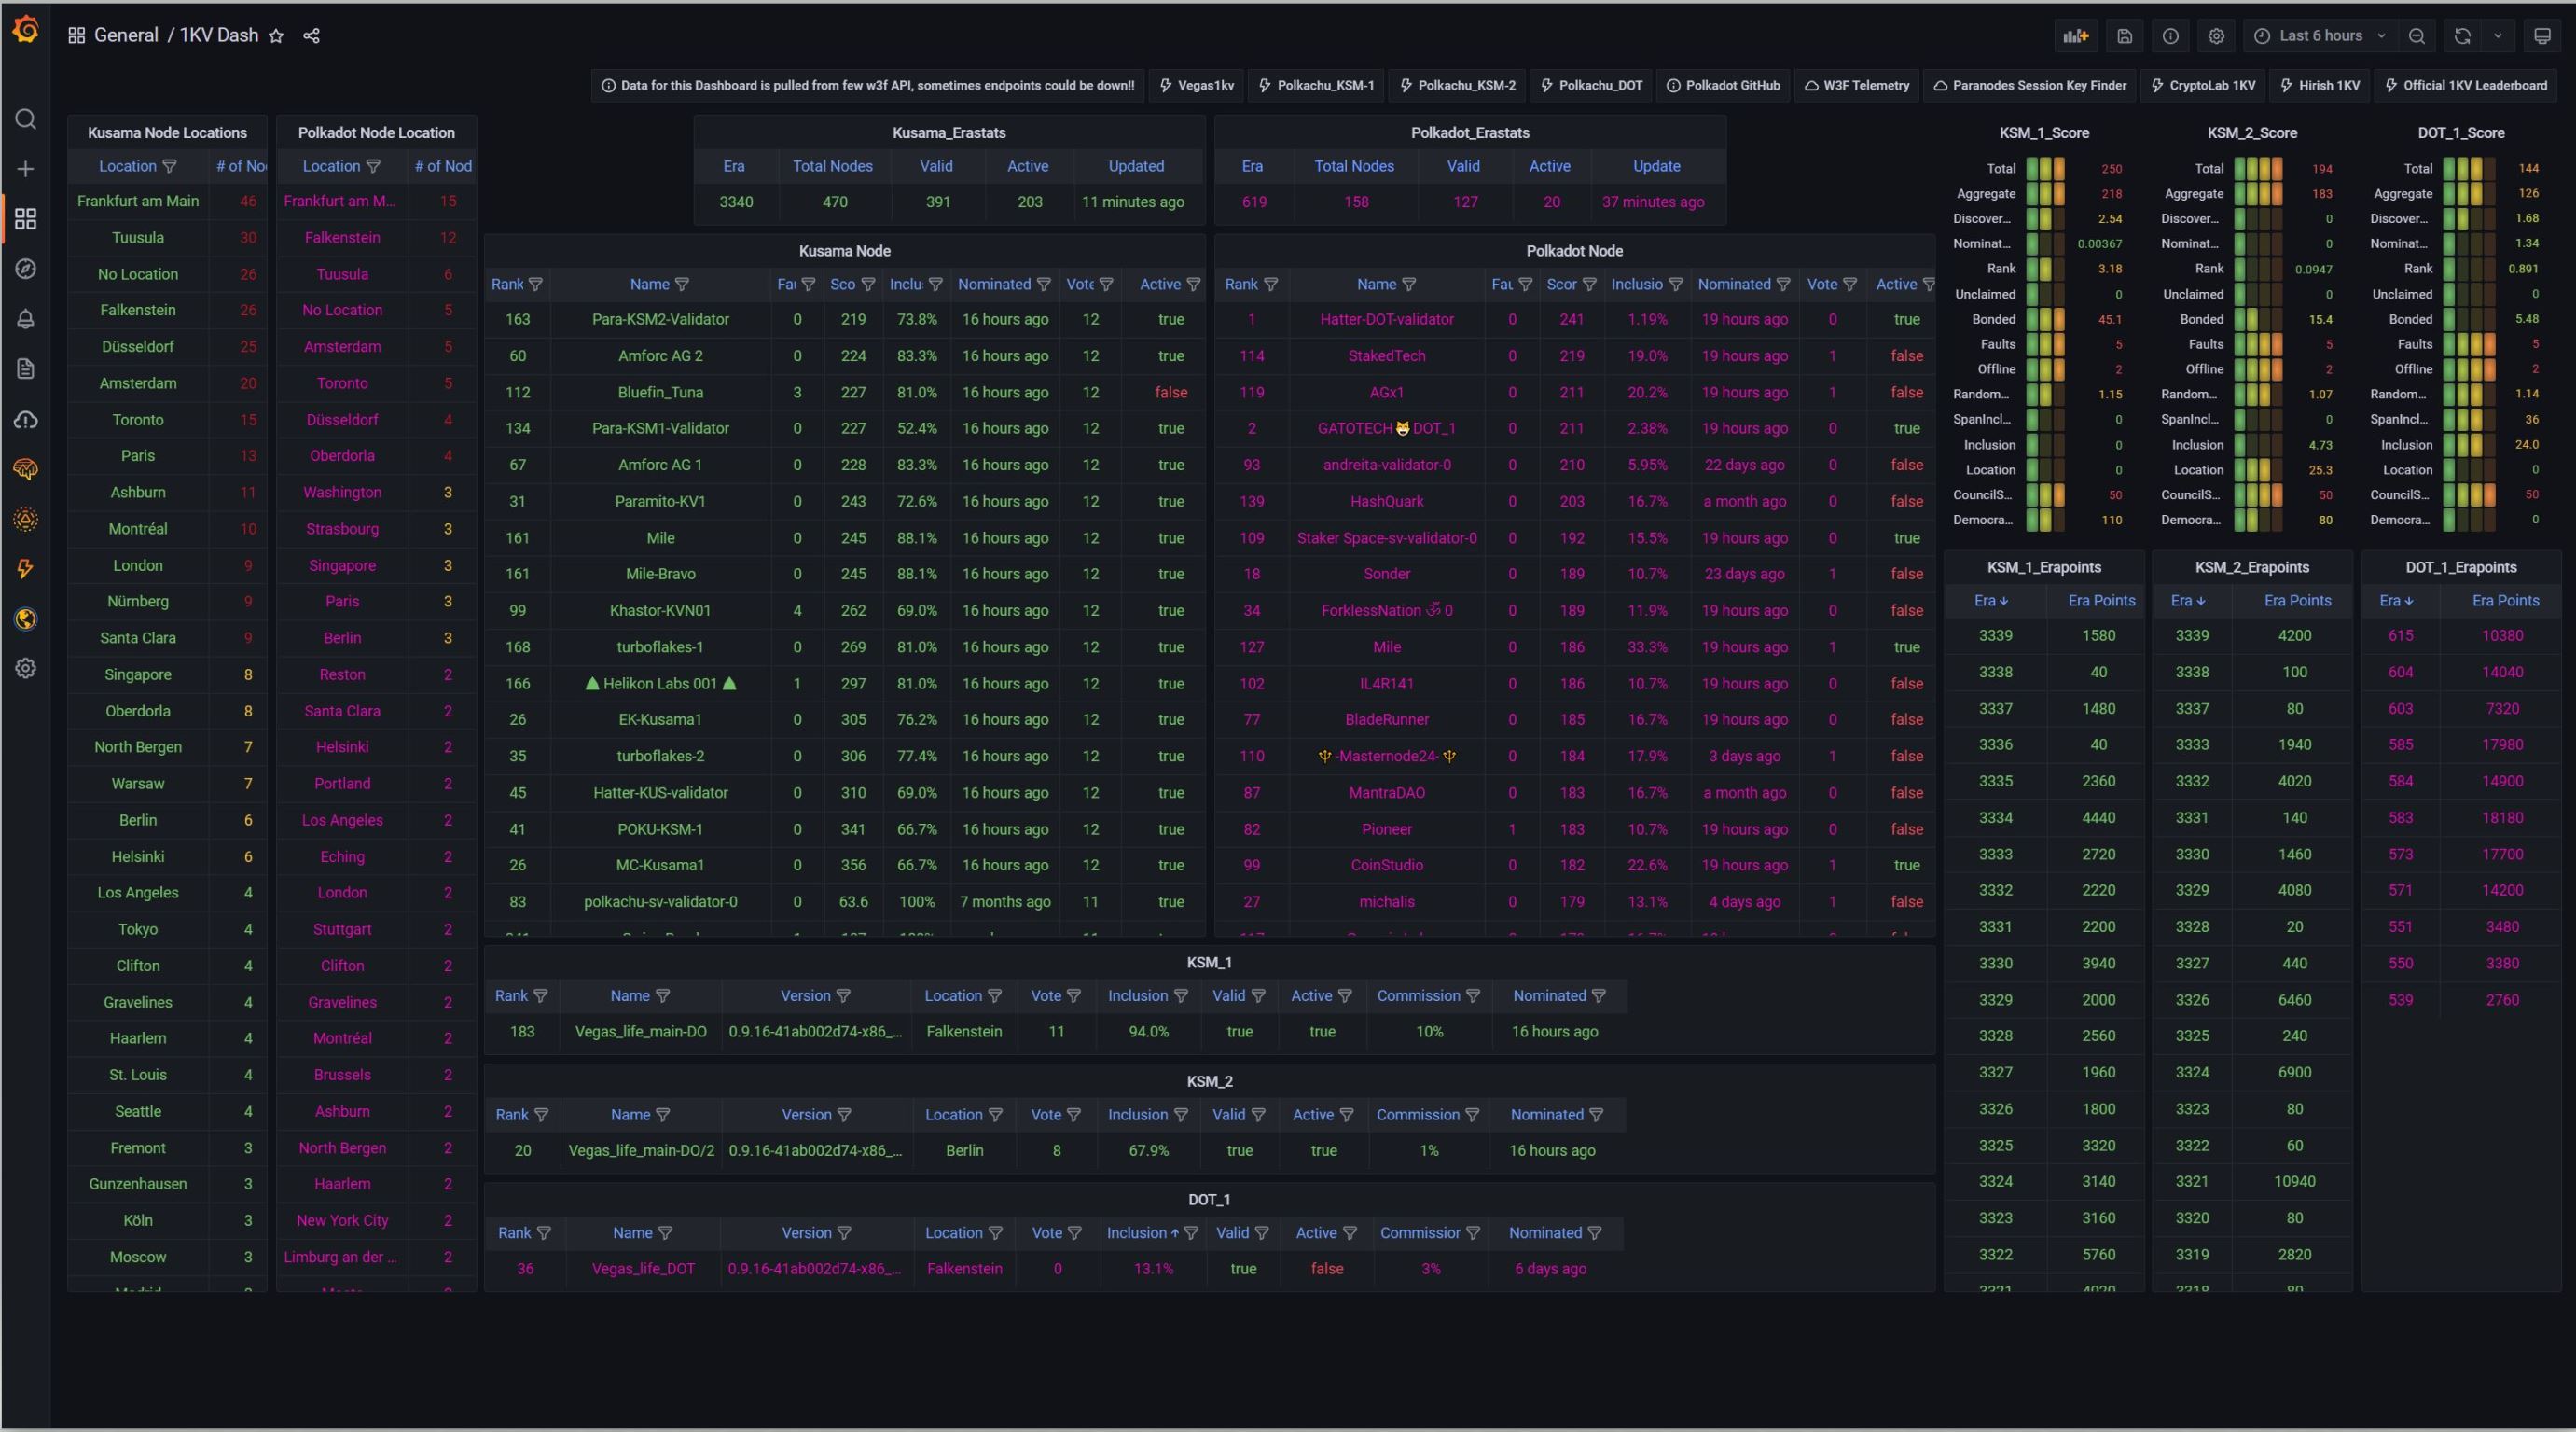
1KV Dash
Dashboard for Polkadot and Kusama 1KV Node operators.
1. Set up a free Grafana Cloud.
https://grafana.com/products/cloud/
You can have up to 10 Dashboards configured for free.
Don’t worry about it, you don’t need the Pro version, everything will work without it.
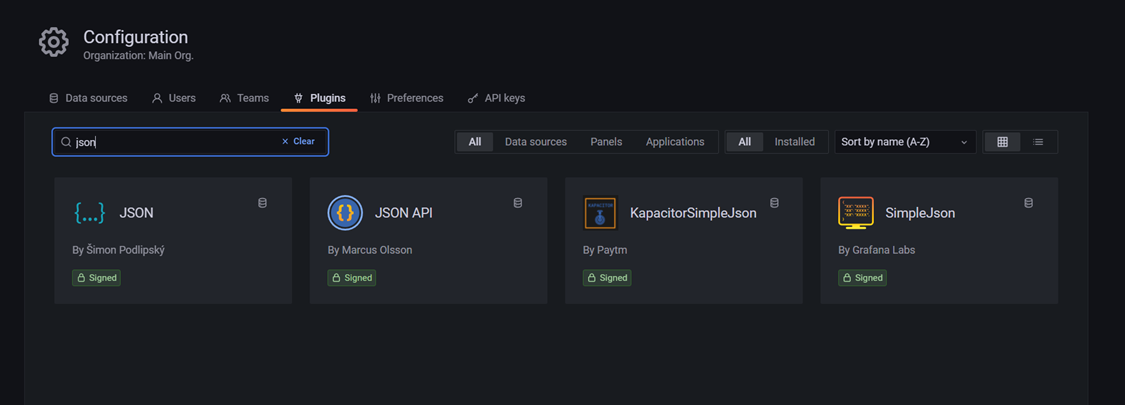
2. Install JSON Plugin
https://grafana.com/grafana/plugins/marcusolsson-json-datasource/
Plugins – JSON API - Version - 1.3.1 Marcus Olsson
Documentation https://marcus.se.net/grafana-json-datasource/
Website https://github.com/marcusolsson/grafana-json-datasource
A data source plugin for loading JSON APIs into Grafana.
It will take few minutes for Plugin to be installed.
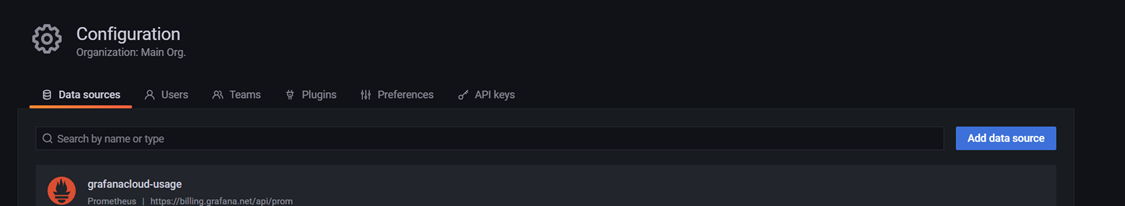
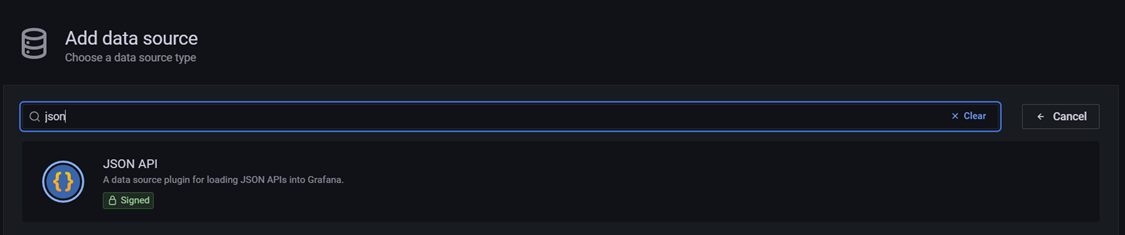
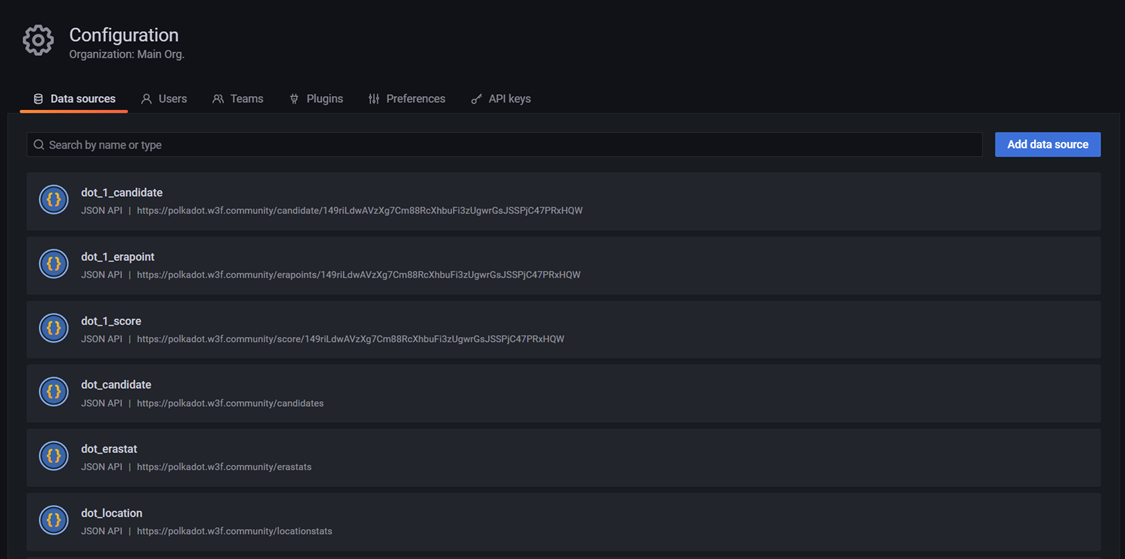
3. Add JSON API Data sources
KUSAMA
ksm_1_candidatehttps://kusama.w3f.community/candidate/Dq97kmsJXGTciU1eMXZMAp4D41Y9e7kQ4hmFBfZW7YD4CCfksm_1_erapointhttps://kusama.w3f.community/erapoints/Dq97kmsJXGTciU1eMXZMAp4D41Y9e7kQ4hmFBfZW7YD4CCfksm_1_scorehttps://kusama.w3f.community/score/Dq97kmsJXGTciU1eMXZMAp4D41Y9e7kQ4hmFBfZW7YD4CCfksm_2_candidatehttps://kusama.w3f.community/candidate/GnqygxyvFN7npYbMUv6t7avBnLrVB37topoDbhPVnBeeuxaksm_2_erapointhttps://kusama.w3f.community/erapoints/GnqygxyvFN7npYbMUv6t7avBnLrVB37topoDbhPVnBeeuxaksm_2_scorehttps://kusama.w3f.community/score/GnqygxyvFN7npYbMUv6t7avBnLrVB37topoDbhPVnBeeuxaksm_candidateshttps://kusama.w3f.community/candidatesksm_erastatshttps://kusama.w3f.community/erastatsksm_locationhttps://kusama.w3f.community/locationstats
POLKADOT
dot_1_candidatehttps://polkadot.w3f.community/candidate/149riLdwAVzXg7Cm88RcXhbuFi3zUgwrGsJSSPjC47PRxHQWdot_1_erapointhttps://polkadot.w3f.community/erapoints/149riLdwAVzXg7Cm88RcXhbuFi3zUgwrGsJSSPjC47PRxHQWdot_1_scorehttps://polkadot.w3f.community/score/149riLdwAVzXg7Cm88RcXhbuFi3zUgwrGsJSSPjC47PRxHQWdot_candidateshttps://polkadot.w3f.community/candidatesdot_erastatshttps://polkadot.w3f.community/erastatsdot_locationhttps://polkadot.w3f.community/locationstats
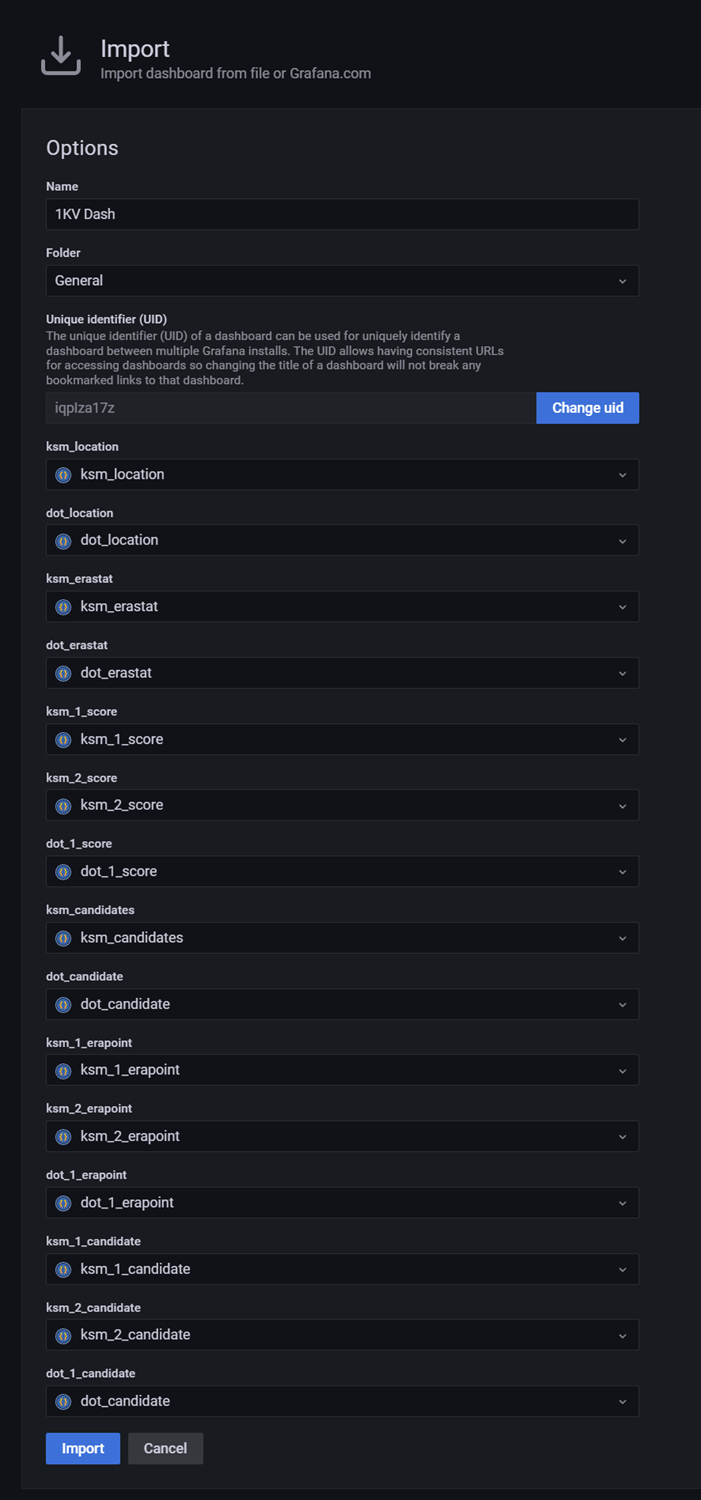
4. Import Dashboard
Match input to data sources from drop down. If you follow the naming convention from step 3 everything should match
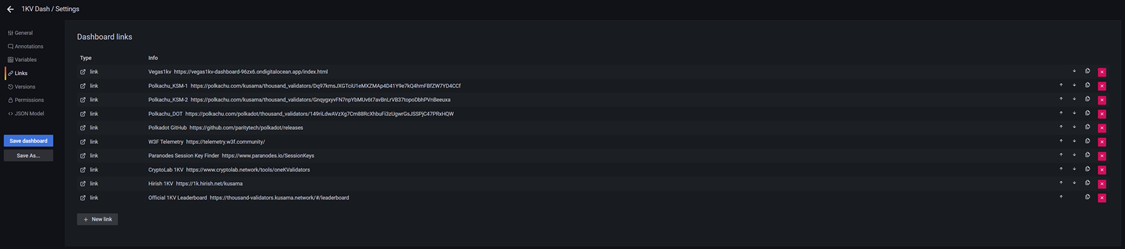
5. Change top of the page links to point to your node.
Top of the page click on the Gear icon > select Links
Modify Polkachu_KSM-1, Polkachu_KSM-2, Polkachu_DOT-1
To modify link, click on the box with arrow next to the link
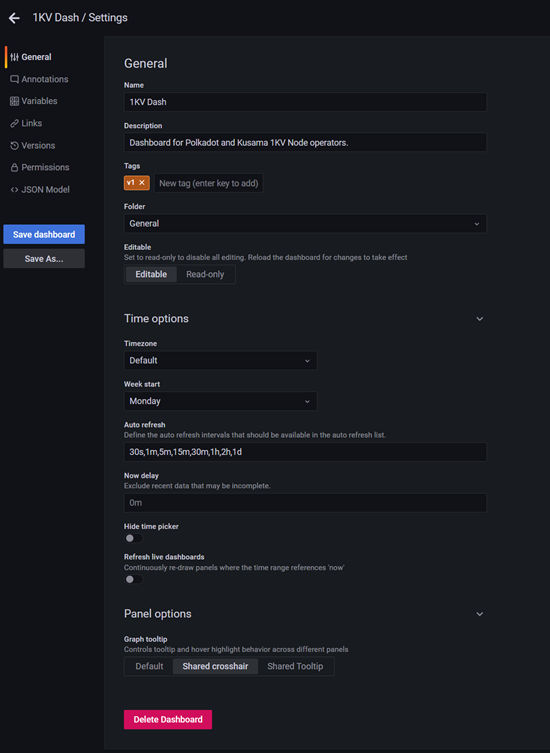
6. Dashboard Refresh
Dashboard is configured not to refresh unless you press the refresh button, this can be changed to refresh every
(30sec, 1min, 5min, 15min, 30min, 1hr, 2hr, 1day)
I don't want to waste Will's resources if I don't need to.
Data source config
Collector config:
Upload an updated version of an exported dashboard.json file from Grafana
| Revision | Description | Created | |
|---|---|---|---|
| Download |